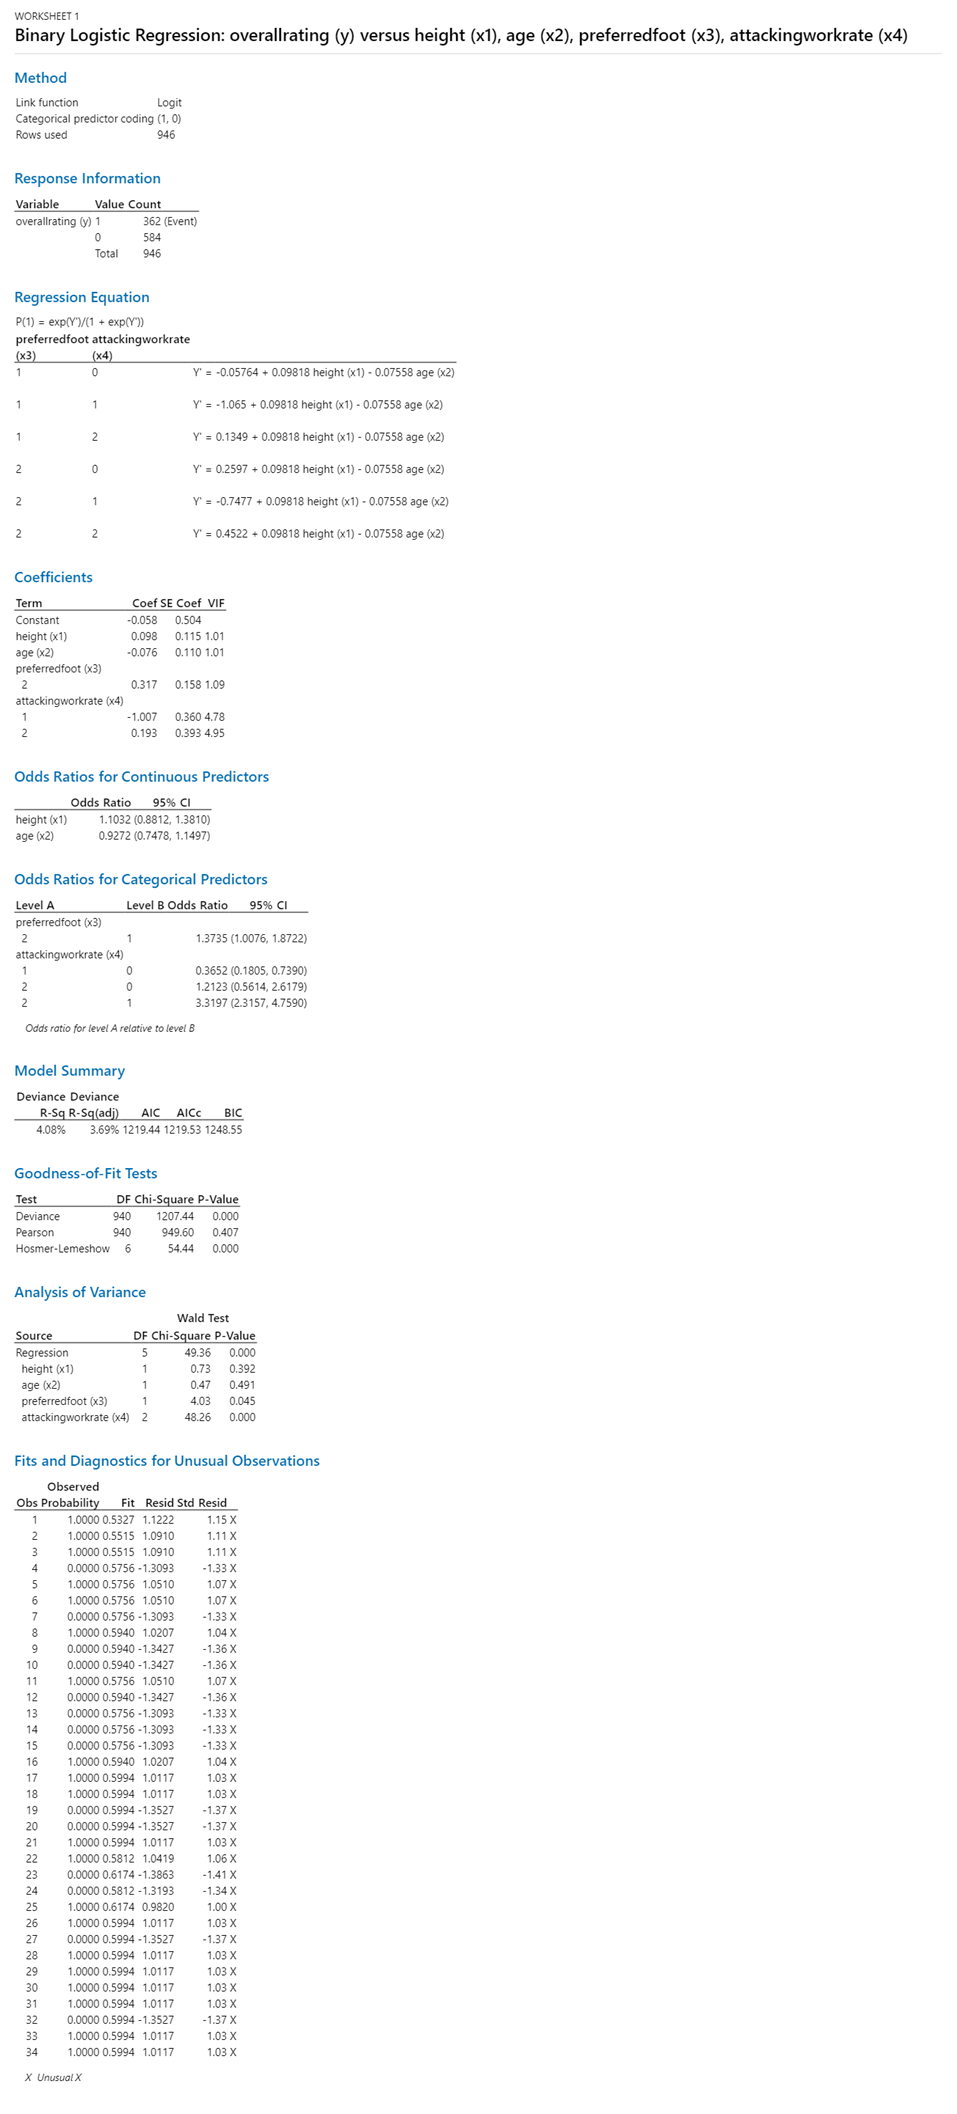
please interpretation this output from minitab (binary logistic regression)
WORKSHEET 1 Binary Logistic Regression: overallrating (y) versus height (x1), age (x2), preferredfoot (x3), attackingworkrate (x4) Method Link function Logit Categorical predictor coding (1, 0) Rows used 946 Response Information Variable Value Count overallrating (y) 1 362 (Event ) 0 584 Total 946 Regression Equation P(1) = exp(Y")/(1 + exp(Y")) preferredfoot attackingworkrate (x3) (x4) Y = -0.05764 + 0.09818 height (x1) - 0.07558 age (x2) Y' = -1.065 + 0.09818 height (x1) - 0.07558 age (x2) 2 Y" = 0.1349 + 0.09818 height (x1) - 0.07558 age (x2) 2 0 Y = 0.2597 + 0.09818 height (x1) - 0.07558 age (x2) 2 Y = -0.7477 + 0.09818 height (x1) - 0.07558 age (x2) N Y' = 0.4522 + 0.09818 height (x1) - 0.07558 age (x2) Coefficients Term Coef SE Coef VIF Constant 0.504 height (x1) 0.098 0.115 1.01 age (x2) -0.076 0.110 1.01 preferredfoot (x3) 0.317 0.158 1.09 attackingworkrate (x4) 1.007 0.360 4.78 0.193 0.393 4.95 Odds Ratios for Continuous Predictors Odds Ratio 95% CI height (x1) 1.1032 (0.8812, 1.3810) age (x2) 0.9272 (0.7478, 1.1497) Odds Ratios for Categorical Predictors Level A Level B Odds Ratio 95% CI preferredfoot (x3) 1.3735 (1.0076, 1.8722) attackingworkrate (x4) 0.3652 (0.1805, 0.7390) NN. 1.2123 (0.5614, 2.6179) 3.3197 (2.3157, 4.7590) Odds ratio for level A relative to level B Model Summary Deviance Deviance R-Sq R-Sq(adj) AIC AICc BIC 4.08% 3.69% 1219.44 1219.53 1248.55 Goodness-of-Fit Tests Test DF Chi-Square P-Value Deviance 940 1207.44 0.000 Pearson 949.60 0.407 Hosmer-Lemeshow 6 Analysis of Variance Wald Test Source OF Chi-Square P-Value Regression 49.36 0.000 height (x1) 0.73 age (x2) 0.47 0.491 preferredfoot (x3) 4.03 0.045 attackingworkrate (x4) 18.26 0.000 Fits and Diagnostics for Unusual Observations Observed Obs Probability Fit Resid Std Resid 1.0000 0.5327 1.1222 1.15 X 1.0000 0.5515 1.0910 1.11 X n D WN 1.0000 0.5515 1.0910 1.11 X 0.0000 0.5756 -1.3093 -1.33 X 1.0000 0.5756 1.0510 1.07 X 1.0000 0.5756 1.0510 1.07 X 0.0000 0.5756 -1.3093 -1.33 X 1.0000 0.5940 1.0207 1.04 X 0.0000 0.5940 -1.3427 -1.36 X 0.0000 0.5940 -1.3427 -1.36 X 1.0000 0.5756 1.0510 1.07 X 12 0.0000 0.5940 -1.3427 -1.36 X 0.0000 0.5756 -1.3093 -1.33 X 0.0000 0.5756 -1.3093 -1.33 X 0.0000 0.5756 -1.3093 -1.33 X 1.0000 0.5940 1.0207 1.04 X 1.0000 0.5994 1.0117 .03 X 1.0000 0.5994 1.0117 1.03 X 0.0000 0.5994 -1.3527 1.37 X 0.0000 0.5994 -1.3527 -1.37 X 1.0000 0.5994 1.0117 1.03 X 1.0000 0.5812 1.0419 1.06 X 0.0000 0.6174 -1.3863 1.41 X 0.0000 0.5812 -1.3193 -1.34 X 1.0000 0.6174 0.9820 1.00 X 1.0000 0.5994 1.0117 1.03 X 0.0000 0.5994 -1.3527 1.37 X 1.0000 0.5994 1.0117 1.03 X 1.0000 0.5994 1.0117 1.03 X 1.0000 0.5994 1.0117 1.03 X 1.0000 0.5994 1.0117 1.03 X 0.0000 0.5994 -1.3527 1.37 X 1.0000 0.5994 1.0117 1.03 X 1.0000 0.5994 1.0117 1.03 X X Unusual X