PLEASE JUST SOLVE TASK 1
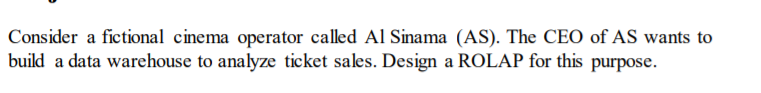

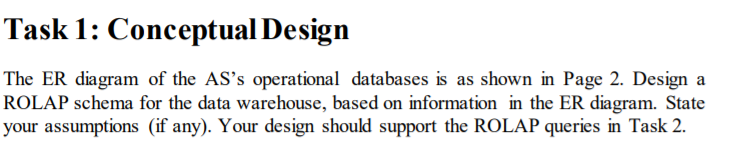
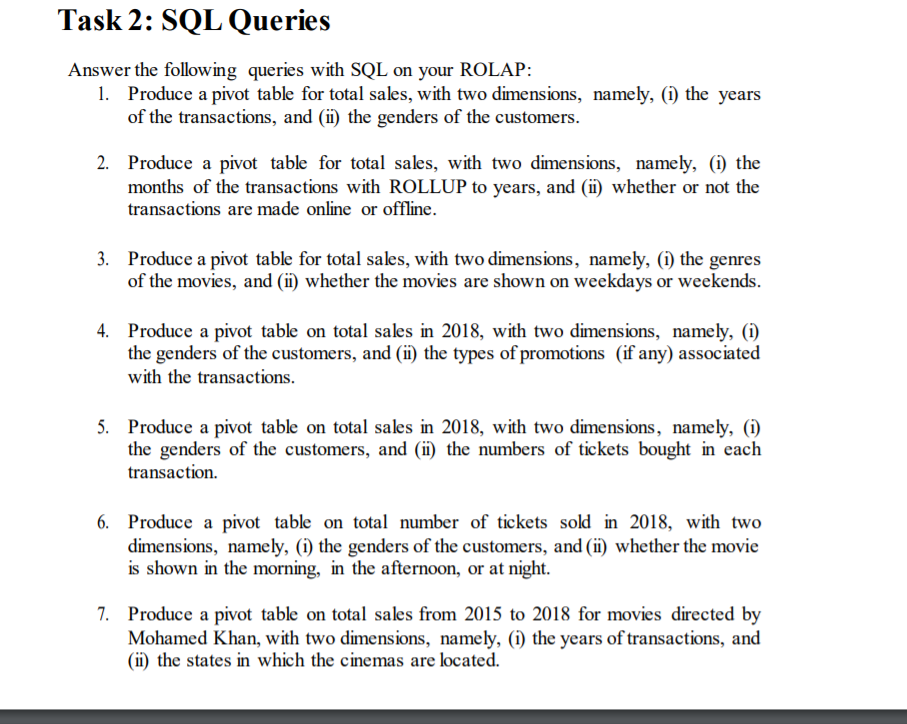
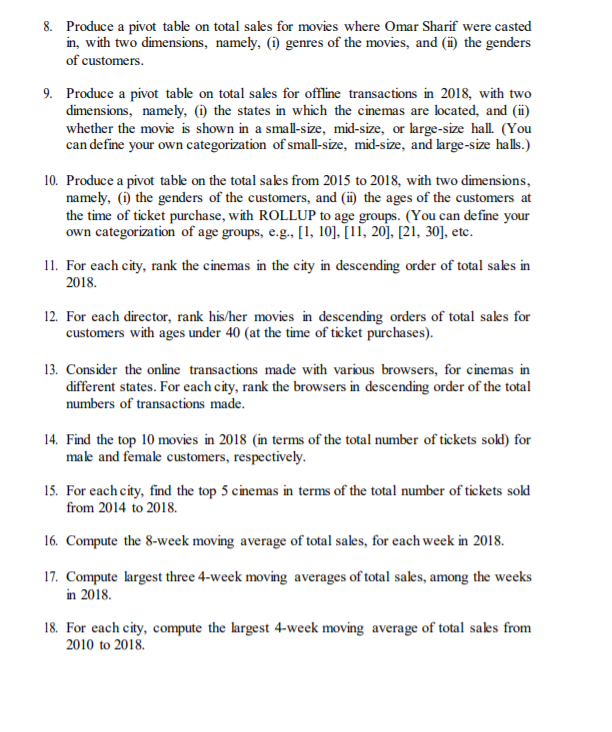
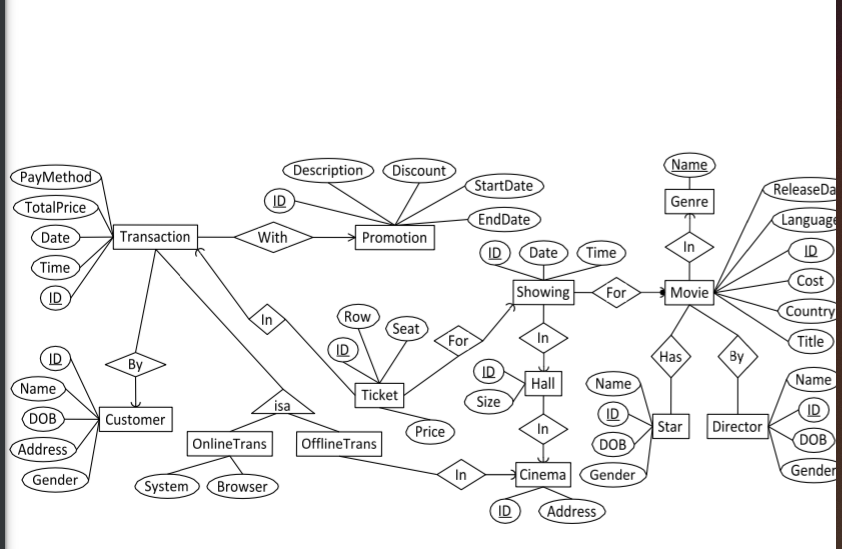
Consider a fictional cinema operator called Al Sinama (AS). The CEO of AS wants to build a data warehouse to analyze ticket sales. Design a ROLAP for this purpose. Task 1: Conceptual Design The ER diagram of the AS's operational databases is as shown in Page 2. Design a ROLAP schema for the data warehouse, based on information in the ER diagram. State your assumptions (if any). Your design should support the ROLAP queries in Task 2. Task 1: Conceptual Design The ER diagram of the AS's operational databases is as shown in Page 2. Design a ROLAP schema for the data warehouse, based on information in the ER diagram. State your assumptions (if any). Your design should support the ROLAP queries in Task 2. Task 2: SQL Queries Answer the following queries with SQL on your ROLAP: 1. Produce a pivot table for total sales, with two dimensions, namely, (i) the years of the transactions, and (ii) the genders of the customers. 2. Produce a pivot table for total sales, with two dimensions, namely, (1) the months of the transactions with ROLLUP to years, and (ii) whether or not the transactions are made online or offline. 3. Produce a pivot table for total sales, with two dimensions, namely, (i) the genres of the movies, and (ii) whether the movies are shown on weekdays or weekends. 4. Produce a pivot table on total sales in 2018, with two dimensions, namely, (i) the genders of the customers, and (ii) the types of promotions (if any) associated with the transactions. 5. Produce a pivot table on total sales in 2018, with two dimensions, namely, (i) the genders of the customers, and (ii) the numbers of tickets bought in each transaction. 6. Produce a pivot table on total number of tickets sold in 2018, with two dimensions, namely, (i) the genders of the customers, and (ii) whether the movie is shown in the morning, in the afternoon, or at night. 7. Produce a pivot table on total sales from 2015 to 2018 for movies directed by Mohamed Khan, with two dimensions, namely, (i) the years of transactions, and (ii) the states in which the cinemas are located. 8. Produce a pivot table on total sales for movies where Omar Sharif were casted in, with two dimensions, namely, (1) genres of the movies, and (b) the genders of customers. 9. Produce a pivot table on total sales for offline transactions in 2018, with two dimensions, namely, (i) the states in which the cinemas are located, and (i) whether the movie is shown in a small-size, mid-size, or large-size hall. (You can define your own categorization of small-size, mid-size, and large-size halls.) 10. Produce a pivot table on the total sales from 2015 to 2018, with two dimensions, namely, the genders of the customers, and (ii) the ages of the customers at the time of ticket purchase, with ROLLUP to age groups. (You can define your own categorization of age groups, e.g., [1, 10], [11, 20], [21, 30], etc. 11. For each city, rank the cinemas in the city in descending order of total sales in 2018. 12. For each director, rank his/her movies in descending orders of total sales for customers with ages under 40 (at the time of ticket purchases). 13. Consider the online transactions made with various browsers, for cinemas in different states. For each city, rank the browsers in descending order of the total numbers of transactions made. 14. Find the top 10 movies in 2018 (in terms of the total number of tickets sold) for male and female customers, respectively. 15. For each city, find the top 5 cinemas in terms of the total number of tickets sold from 2014 to 2018 16. Compute the 8-week moving average of total sales, for each week in 2018. 17. Compute largest three 4-week moving averages of total sales, among the weeks in 2018 18. For each city, compute the largest 4-week moving average of total sales from 2010 to 2018 Description Discount Name PayMethod TotalPrice StartDate Release Da ID Genre EndDate Language Date Transaction With Promotion ID Date Time In ID Time Cost ID Showing For Movie In Country Row Seat For In Title ID D . Has By , ID Name Hall Name Name Ticket isa Size DOB D Customer Price In D (DOB Star Director Address Online Trans Offline Trans DOB Gender In Cinema Gender Gender System Browser ID Address Consider a fictional cinema operator called Al Sinama (AS). The CEO of AS wants to build a data warehouse to analyze ticket sales. Design a ROLAP for this purpose. Task 1: Conceptual Design The ER diagram of the AS's operational databases is as shown in Page 2. Design a ROLAP schema for the data warehouse, based on information in the ER diagram. State your assumptions (if any). Your design should support the ROLAP queries in Task 2. Task 1: Conceptual Design The ER diagram of the AS's operational databases is as shown in Page 2. Design a ROLAP schema for the data warehouse, based on information in the ER diagram. State your assumptions (if any). Your design should support the ROLAP queries in Task 2. Task 2: SQL Queries Answer the following queries with SQL on your ROLAP: 1. Produce a pivot table for total sales, with two dimensions, namely, (i) the years of the transactions, and (ii) the genders of the customers. 2. Produce a pivot table for total sales, with two dimensions, namely, (1) the months of the transactions with ROLLUP to years, and (ii) whether or not the transactions are made online or offline. 3. Produce a pivot table for total sales, with two dimensions, namely, (i) the genres of the movies, and (ii) whether the movies are shown on weekdays or weekends. 4. Produce a pivot table on total sales in 2018, with two dimensions, namely, (i) the genders of the customers, and (ii) the types of promotions (if any) associated with the transactions. 5. Produce a pivot table on total sales in 2018, with two dimensions, namely, (i) the genders of the customers, and (ii) the numbers of tickets bought in each transaction. 6. Produce a pivot table on total number of tickets sold in 2018, with two dimensions, namely, (i) the genders of the customers, and (ii) whether the movie is shown in the morning, in the afternoon, or at night. 7. Produce a pivot table on total sales from 2015 to 2018 for movies directed by Mohamed Khan, with two dimensions, namely, (i) the years of transactions, and (ii) the states in which the cinemas are located. 8. Produce a pivot table on total sales for movies where Omar Sharif were casted in, with two dimensions, namely, (1) genres of the movies, and (b) the genders of customers. 9. Produce a pivot table on total sales for offline transactions in 2018, with two dimensions, namely, (i) the states in which the cinemas are located, and (i) whether the movie is shown in a small-size, mid-size, or large-size hall. (You can define your own categorization of small-size, mid-size, and large-size halls.) 10. Produce a pivot table on the total sales from 2015 to 2018, with two dimensions, namely, the genders of the customers, and (ii) the ages of the customers at the time of ticket purchase, with ROLLUP to age groups. (You can define your own categorization of age groups, e.g., [1, 10], [11, 20], [21, 30], etc. 11. For each city, rank the cinemas in the city in descending order of total sales in 2018. 12. For each director, rank his/her movies in descending orders of total sales for customers with ages under 40 (at the time of ticket purchases). 13. Consider the online transactions made with various browsers, for cinemas in different states. For each city, rank the browsers in descending order of the total numbers of transactions made. 14. Find the top 10 movies in 2018 (in terms of the total number of tickets sold) for male and female customers, respectively. 15. For each city, find the top 5 cinemas in terms of the total number of tickets sold from 2014 to 2018 16. Compute the 8-week moving average of total sales, for each week in 2018. 17. Compute largest three 4-week moving averages of total sales, among the weeks in 2018 18. For each city, compute the largest 4-week moving average of total sales from 2010 to 2018 Description Discount Name PayMethod TotalPrice StartDate Release Da ID Genre EndDate Language Date Transaction With Promotion ID Date Time In ID Time Cost ID Showing For Movie In Country Row Seat For In Title ID D . Has By , ID Name Hall Name Name Ticket isa Size DOB D Customer Price In D (DOB Star Director Address Online Trans Offline Trans DOB Gender In Cinema Gender Gender System Browser ID Address