(PLEASE KINDLY SEE THE THREE FIGURES/OUESTION THAT WILL ENABLE YOU TO ANSWER WHAT WAS ASKED IN THE FIRST QUESTIONS PLEASE, THE HOME WORK IS DUE TONIGHT) ALL ALL.( someone shuld help for this questions)


c
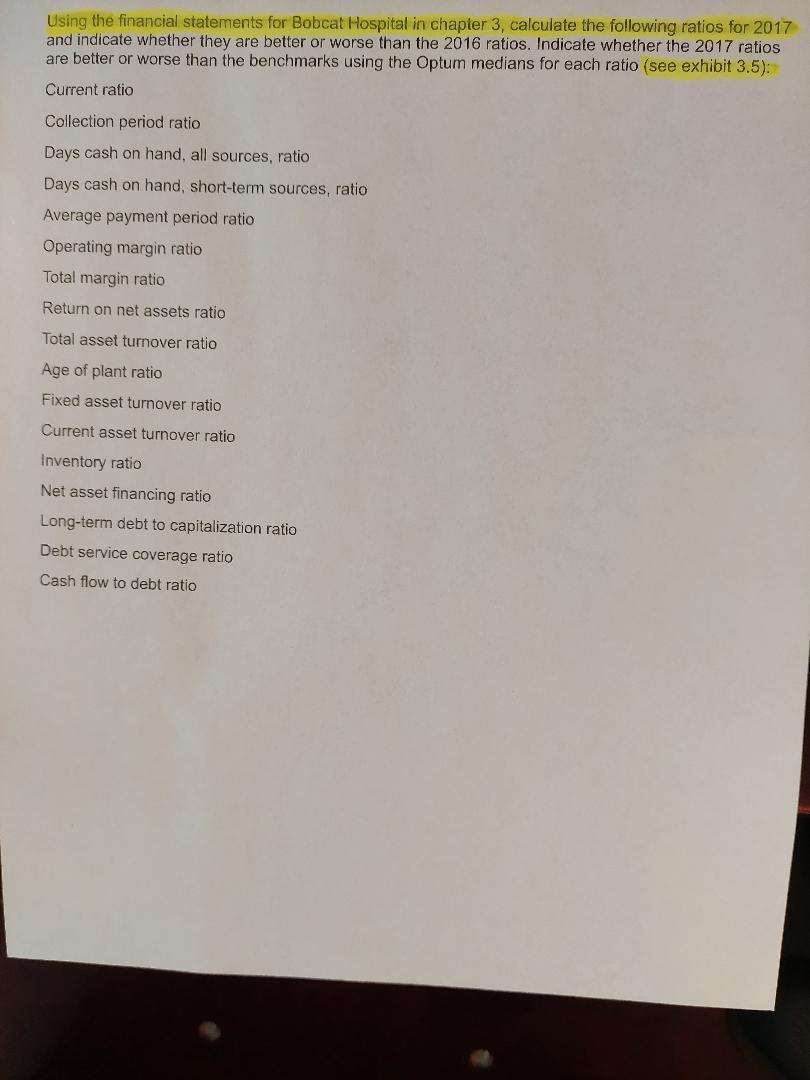
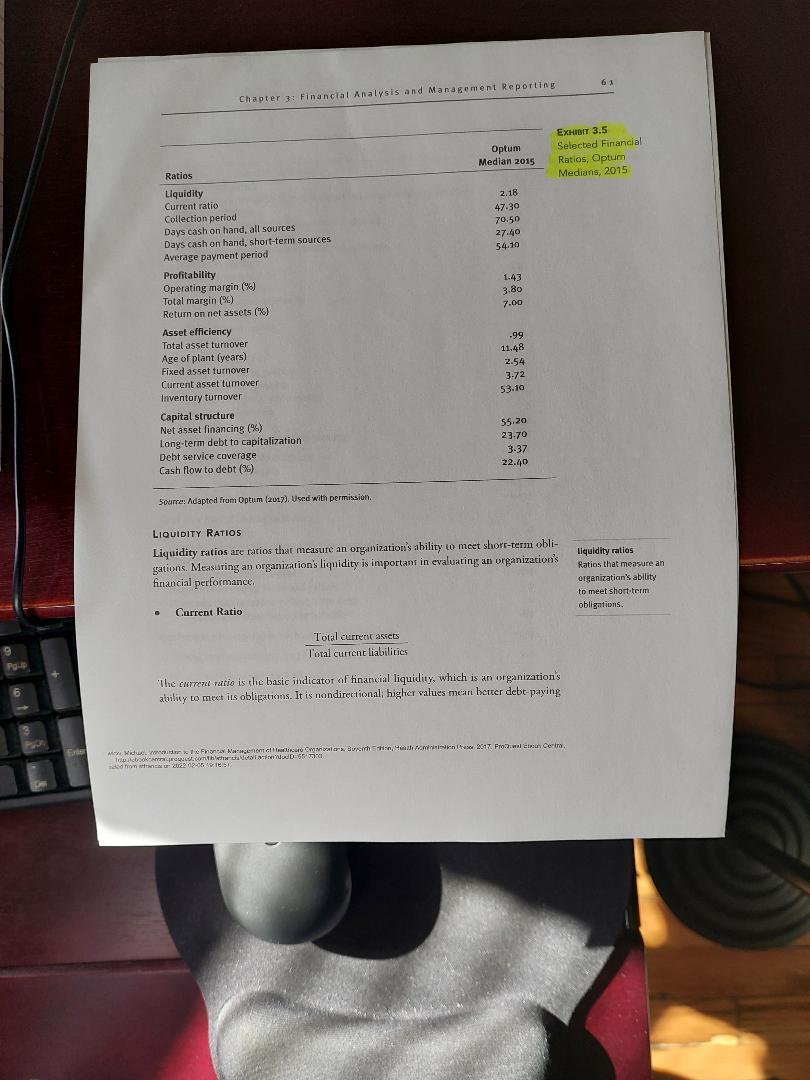
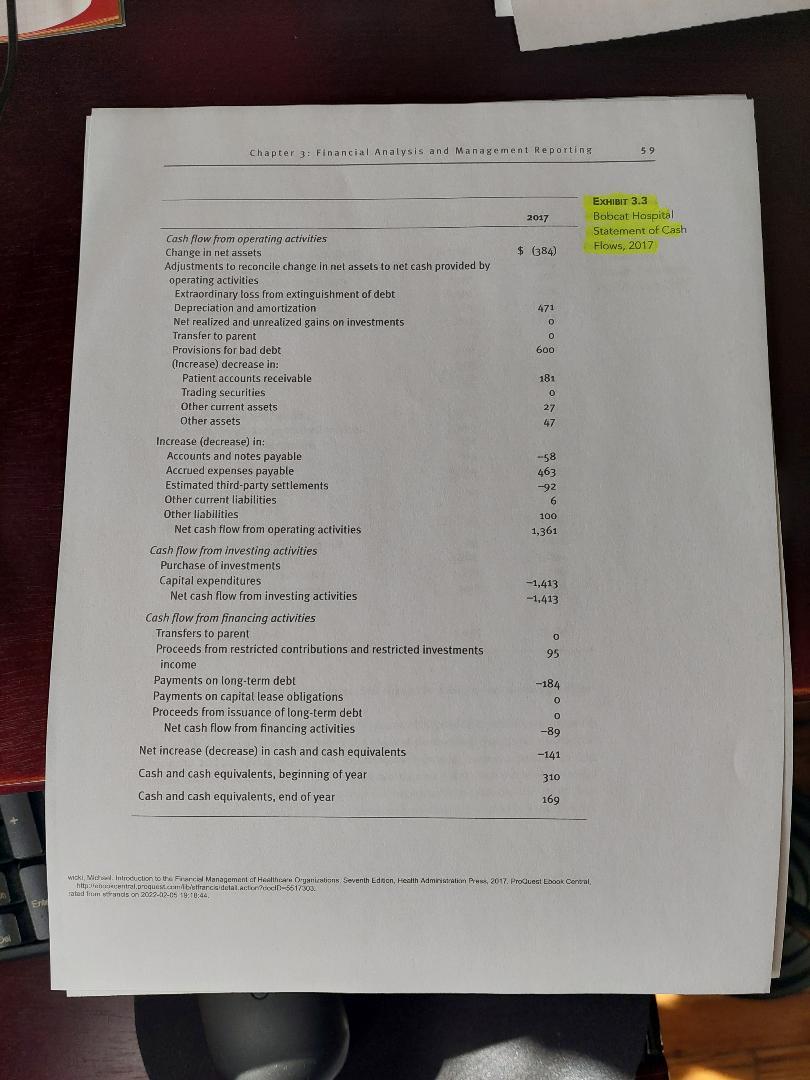
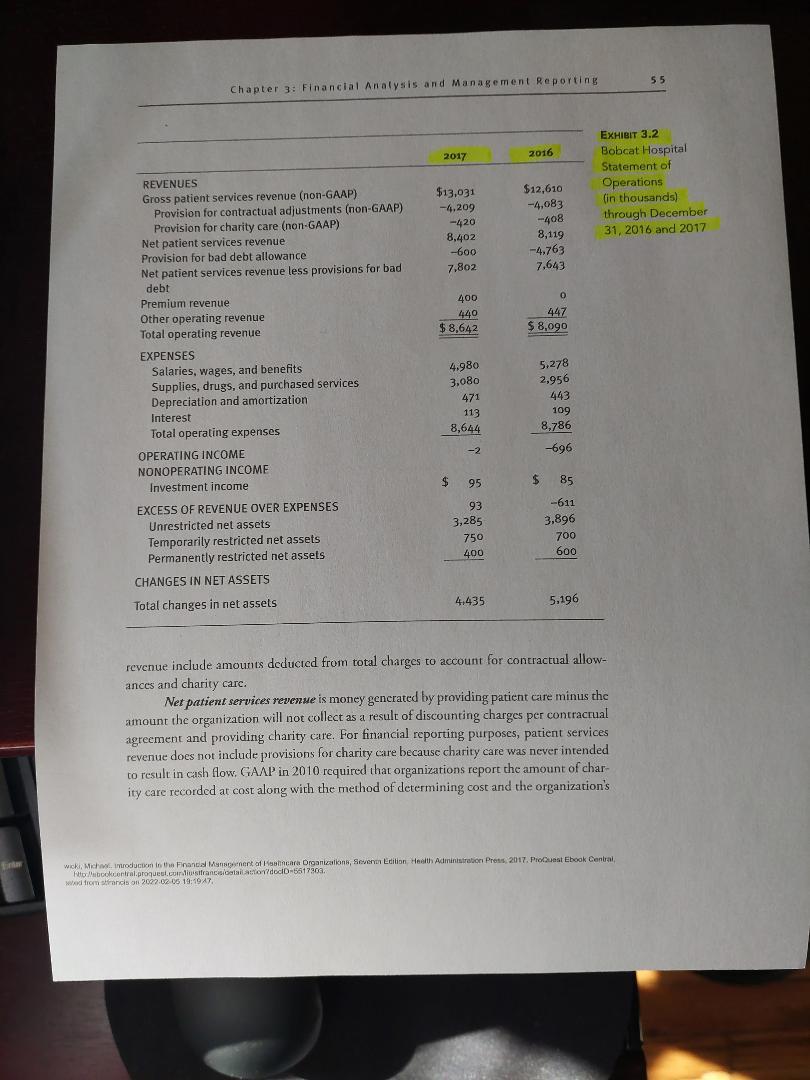
Using the financial statements for Bobcat Hospital in chapter 3, calculate the following ratios for 2017 and indicate whether they are better or worse than the 2016 ratios. Indicate whether the 2017 ratios are better or worse than the benchmarks using the Optum medians for each ratio (see exhibit 3.5): Current ratio Collection period ratio Days cash on hand, all sources, ratio Days cash on hand, short-term sources, ratio Average payment period ratio Operating margin ratio Total margin ratio Return on net assets ratio Total asset turnover ratio Age of plant ratio Fixed asset turnover ratio Current asset turnover ratio Inventory ratio Net asset financing ratio Long-term debt to capitalization ratio Debt service coverage ratio Cash flow to debt ratio 61 Chapter 3: Financial Analysis and Management Reporting Optum Median 2015 EXHIBIT 3.5 Selected Financial Ratios, Optum Medians, 2015 Ratios 2.18 47.30 70.50 27.40 54.10 1.43 3.80 7.00 Liquidity Current ratio Collection period Days cash on hand, all sources Days cash on hand, short-term sources Average payment period Profitability Operating margin (%) Total margin (%) Return on net assets (%) Asset efficiency Total asset turnover Age of plant (years) Fixed asset turnover Current asset tumover Inventory turnover Capital structure Net asset financing (% Long-term debt to capitalization Debt service coverage Cash flow to debt (%) .99 11.48 2.54 3.72 53.10 55.20 23.70 3-37 22.40 5ourne: Adapted from Optum (2017). Used with permission LIQUIDITY RATIOS Liquidity ratios are ratios that measure an organization's ability to meet short-term obli- gations. Measuring an organization's liquidity is important in evaluating an organization's financial performance liquidity ralios Ratios that measure an organization's ability to meet short-term obligations. . Current Ratio Total current assets Total current liabilities Po the current ratio is the basic indicator of financial liquidity, which is an organization's ability to meet its obligations. It is nondirectional higher values mean better debt-paying Womers From Behn, Halloween 2017 From Elean Coir WWFhotthe man : 2029 02-01 Chapter 3: Financial Analysis and Management Reporting 59 2017 EXHIBIT 3.3 Bobcat Hospital Statement of Cash Flows, 2017 $ (384) 471 0 600 181 0 0 27 47 -58 Cash flow from operating activities Change in net assets Adjustments to reconcile change in net assets to net cash provided by operating activities Extraordinary loss from extinguishment of debt Depreciation and amortization Net realized and unrealized gains on investments Transfer to parent Provisions for bad debt Increase) decrease in: Patient accounts receivable Trading securities Other current assets Other assets Increase (decrease) in: Accounts and notes payable Accrued expenses payable Estimated third-party settlements Other current liabilities Other liabilities Net cash flow from operating activities Cash flow from investing activities Purchase of investments Capital expenditures Net cash flow from investing activities Cash flow from financing activities Transfers to parent Proceeds from restricted contributions and restricted investments income Payments on long-term debt Payments on capital lease obligations Proceeds from issuance of long-term debt Net cash flow from financing activities Net increase (decrease) in cash and cash equivalents Cash and cash equivalents, beginning of year Cash and cash equivalents, end of year 463 -92 6 100 1,361 -1,413 -1,413 o 95 -184 0 o -89 -141 310 169 wicki Minduction to the Francial Management of Health Organizations Seventh Edson, Health Administration Press 2017. ProQuest Look Central httecentral.proquesta bestiarcadotal actor D-5617303 Edition, sated from wunds on 2022-12-05 18:10:44 Er DO 55 Chapter 3: Financial Analysis and Management Reporting 2017 2016 EXHIBIT 3.2 Bobcat Hospital Statement of Operations in thousands) through December 31, 2016 and 2017 $12,610 -4,083 -408 8,119 -4.763 $13,031 -4,209 -420 8,402 -600 7.802 7.643 400 440 $ 8,642 0 447 $ 8,090 REVENUES Gross patient services revenue (non-GAAP) Provision for contractual adjustments (non-GAAP) Provision for charity care (non-GAAP) Net patient services revenue Provision for bad debt allowance Net patient services revenue less provisions for bad debt Premium revenue Other operating revenue Total operating revenue EXPENSES Salaries, wages, and benefits Supplies, drugs, and purchased services Depreciation and amortization Interest Total operating expenses OPERATING INCOME NONOPERATING INCOME Investment income 4.980 3,080 471 113 5,278 2,956 443 109 8,786 8,644 -2 -696 $ 95 $ 85 EXCESS OF REVENUE OVER EXPENSES Unrestricted net assets Temporarily restricted net assets Permanently restricted net assets 93 3,285 750 400 -611 3,896 700 600 CHANGES IN NET ASSETS 4,435 Total changes in net assets 5.196 revenue include amounts deducted from total charges to account for contractual allow- ances and charity carc. Net patient services revenue is money generated by providing patient care minus the amount the organization will not collect as a result of discounting charges per contractual agreement and providing charity care. For financial reporting purposes, patient services revenue does not include provisions for charity care because charity care was never intended to result in cash flow. GAAP in 2010 required that organizations report the amount of char- ity care recorded at cost along with the method of determining cost and the organization's wick, Mchoduction to the Financial Manager of ticara Organizations, Sever Edition Health Administration Press, 2017. Prouest Ebook Central Patobookcontrol.proquest.corristfrancesitandoD-5517303 womandis on 2002.02.06 19:1947 Using the financial statements for Bobcat Hospital in chapter 3, calculate the following ratios for 2017 and indicate whether they are better or worse than the 2016 ratios. Indicate whether the 2017 ratios are better or worse than the benchmarks using the Optum medians for each ratio (see exhibit 3.5): Current ratio Collection period ratio Days cash on hand, all sources, ratio Days cash on hand, short-term sources, ratio Average payment period ratio Operating margin ratio Total margin ratio Return on net assets ratio Total asset turnover ratio Age of plant ratio Fixed asset turnover ratio Current asset turnover ratio Inventory ratio Net asset financing ratio Long-term debt to capitalization ratio Debt service coverage ratio Cash flow to debt ratio 61 Chapter 3: Financial Analysis and Management Reporting Optum Median 2015 EXHIBIT 3.5 Selected Financial Ratios, Optum Medians, 2015 Ratios 2.18 47.30 70.50 27.40 54.10 1.43 3.80 7.00 Liquidity Current ratio Collection period Days cash on hand, all sources Days cash on hand, short-term sources Average payment period Profitability Operating margin (%) Total margin (%) Return on net assets (%) Asset efficiency Total asset turnover Age of plant (years) Fixed asset turnover Current asset tumover Inventory turnover Capital structure Net asset financing (% Long-term debt to capitalization Debt service coverage Cash flow to debt (%) .99 11.48 2.54 3.72 53.10 55.20 23.70 3-37 22.40 5ourne: Adapted from Optum (2017). Used with permission LIQUIDITY RATIOS Liquidity ratios are ratios that measure an organization's ability to meet short-term obli- gations. Measuring an organization's liquidity is important in evaluating an organization's financial performance liquidity ralios Ratios that measure an organization's ability to meet short-term obligations. . Current Ratio Total current assets Total current liabilities Po the current ratio is the basic indicator of financial liquidity, which is an organization's ability to meet its obligations. It is nondirectional higher values mean better debt-paying Womers From Behn, Halloween 2017 From Elean Coir WWFhotthe man : 2029 02-01 Chapter 3: Financial Analysis and Management Reporting 59 2017 EXHIBIT 3.3 Bobcat Hospital Statement of Cash Flows, 2017 $ (384) 471 0 600 181 0 0 27 47 -58 Cash flow from operating activities Change in net assets Adjustments to reconcile change in net assets to net cash provided by operating activities Extraordinary loss from extinguishment of debt Depreciation and amortization Net realized and unrealized gains on investments Transfer to parent Provisions for bad debt Increase) decrease in: Patient accounts receivable Trading securities Other current assets Other assets Increase (decrease) in: Accounts and notes payable Accrued expenses payable Estimated third-party settlements Other current liabilities Other liabilities Net cash flow from operating activities Cash flow from investing activities Purchase of investments Capital expenditures Net cash flow from investing activities Cash flow from financing activities Transfers to parent Proceeds from restricted contributions and restricted investments income Payments on long-term debt Payments on capital lease obligations Proceeds from issuance of long-term debt Net cash flow from financing activities Net increase (decrease) in cash and cash equivalents Cash and cash equivalents, beginning of year Cash and cash equivalents, end of year 463 -92 6 100 1,361 -1,413 -1,413 o 95 -184 0 o -89 -141 310 169 wicki Minduction to the Francial Management of Health Organizations Seventh Edson, Health Administration Press 2017. ProQuest Look Central httecentral.proquesta bestiarcadotal actor D-5617303 Edition, sated from wunds on 2022-12-05 18:10:44 Er DO 55 Chapter 3: Financial Analysis and Management Reporting 2017 2016 EXHIBIT 3.2 Bobcat Hospital Statement of Operations in thousands) through December 31, 2016 and 2017 $12,610 -4,083 -408 8,119 -4.763 $13,031 -4,209 -420 8,402 -600 7.802 7.643 400 440 $ 8,642 0 447 $ 8,090 REVENUES Gross patient services revenue (non-GAAP) Provision for contractual adjustments (non-GAAP) Provision for charity care (non-GAAP) Net patient services revenue Provision for bad debt allowance Net patient services revenue less provisions for bad debt Premium revenue Other operating revenue Total operating revenue EXPENSES Salaries, wages, and benefits Supplies, drugs, and purchased services Depreciation and amortization Interest Total operating expenses OPERATING INCOME NONOPERATING INCOME Investment income 4.980 3,080 471 113 5,278 2,956 443 109 8,786 8,644 -2 -696 $ 95 $ 85 EXCESS OF REVENUE OVER EXPENSES Unrestricted net assets Temporarily restricted net assets Permanently restricted net assets 93 3,285 750 400 -611 3,896 700 600 CHANGES IN NET ASSETS 4,435 Total changes in net assets 5.196 revenue include amounts deducted from total charges to account for contractual allow- ances and charity carc. Net patient services revenue is money generated by providing patient care minus the amount the organization will not collect as a result of discounting charges per contractual agreement and providing charity care. For financial reporting purposes, patient services revenue does not include provisions for charity care because charity care was never intended to result in cash flow. GAAP in 2010 required that organizations report the amount of char- ity care recorded at cost along with the method of determining cost and the organization's wick, Mchoduction to the Financial Manager of ticara Organizations, Sever Edition Health Administration Press, 2017. Prouest Ebook Central Patobookcontrol.proquest.corristfrancesitandoD-5517303 womandis on 2002.02.06 19:1947


