

Question
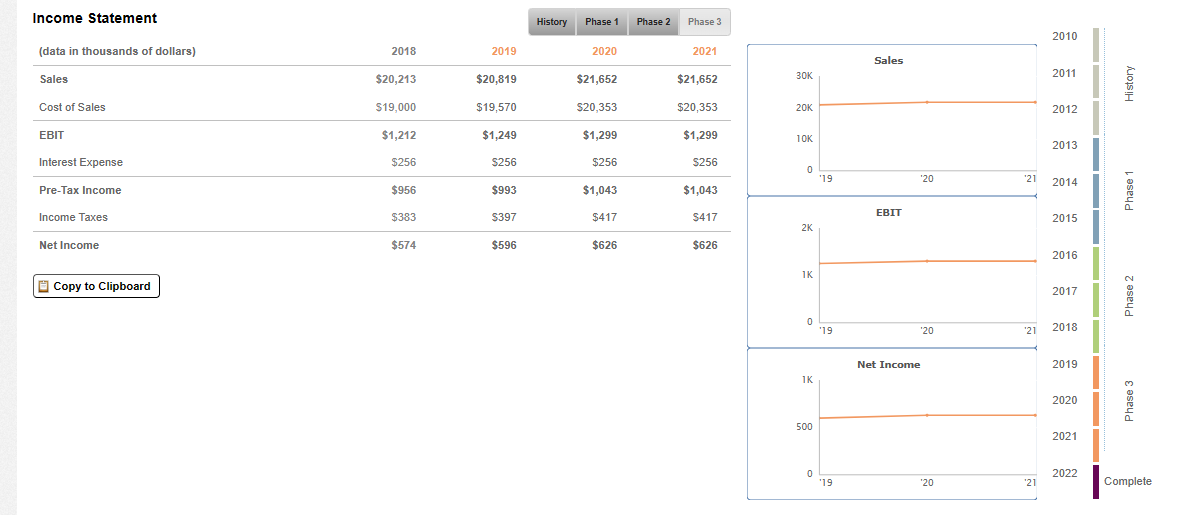
Please leverage graphs below to help with the questions below The company operates on thin margins, with a constrained cash position and limited available credit.
Please leverage graphs below to help with the questions below
The company operates on thin margins, with a constrained cash position and limited available credit. Looking at the income statement, balance sheet, and statement of cash flows for the company after completing
What were the pertinent findings of your analysis? How did you arrive at your decisions, and how did you use this information to calculate working capital for the company?
What recommendations would you make to improve the situation for the company? Briefly describe your recommendations.
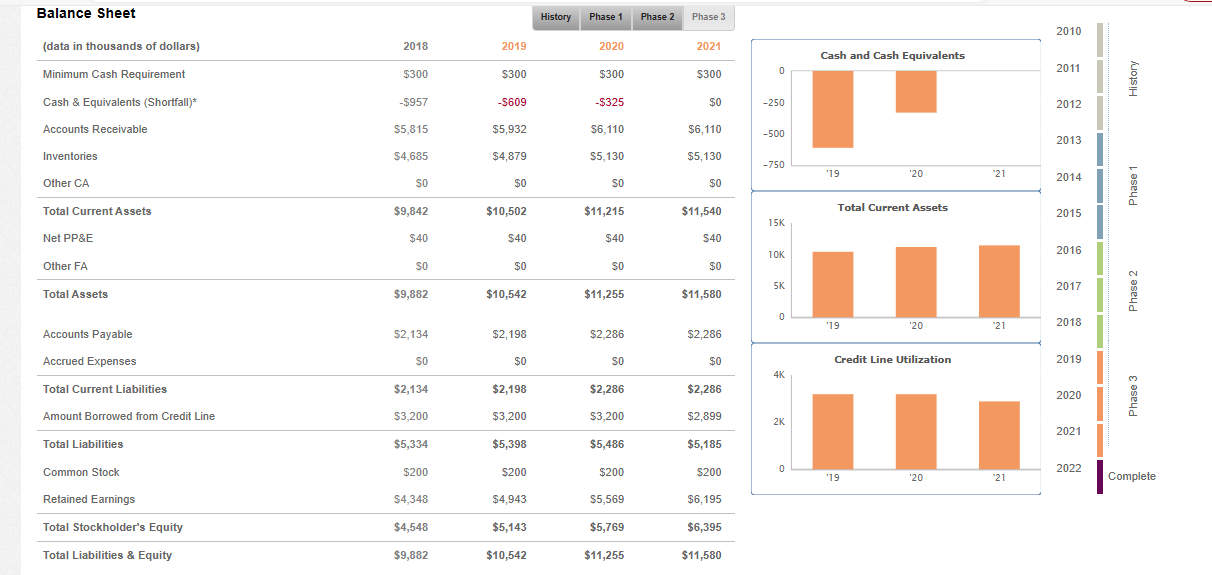
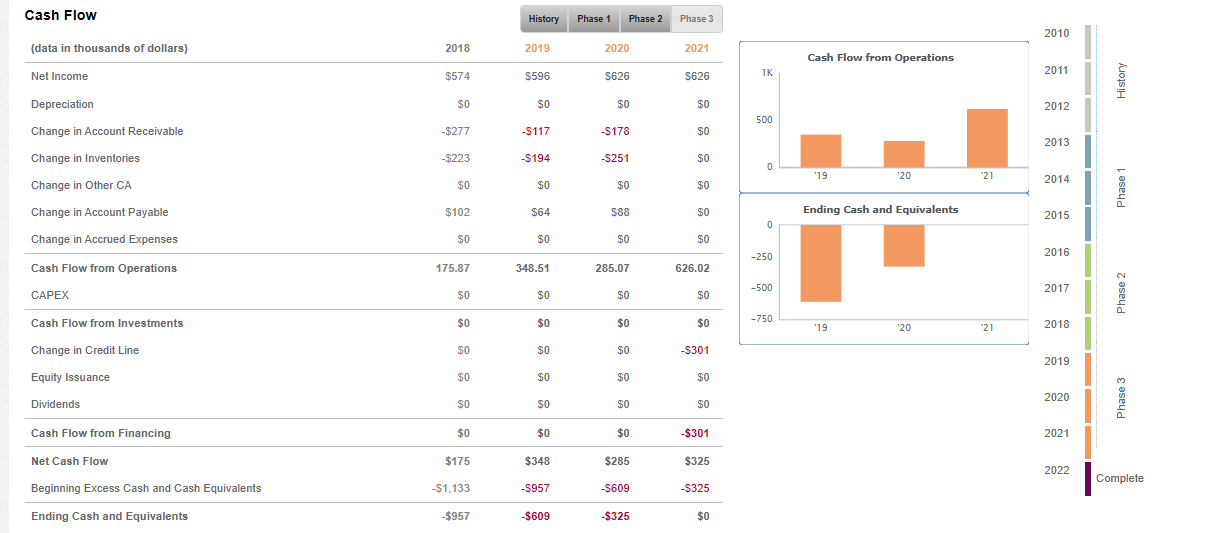 \begin{tabular}{|c|c|c|c|c|c|c|} \hline Balance Sheet & & & History & Phase 1 & Phase 2 & Phase 3 \\ \hline (data in thousands of dollars) & 2018 & 2019 & & 2020 & & 2021 \\ \hline Minimum Cash Requirement & $300 & $300 & & $300 & & $300 \\ \hline Cash \& Equivalents (Shortfall)* & $957 & $609 & & $325 & & $0 \\ \hline Accounts Receivable & $5,815 & $5,932 & & $6,110 & & $6,110 \\ \hline Inventories & $4,685 & $4,879 & & $5,130 & & $5,130 \\ \hline Other CA & so & $0 & & so & & $0 \\ \hline Total Current Assets & $9,842 & $10,502 & & $11,215 & & $11,540 \\ \hline Net PP\&E & $40 & $40 & & $40 & & $40 \\ \hline Other FA & so & $0 & & so & & $0 \\ \hline Total Assets & $9,882 & $10,542 & & $11,255 & & $11,580 \\ \hline Accounts Payable & $2,134 & $2,198 & & $2,286 & & $2,286 \\ \hline Accrued Expenses & so & $0 & & so & & $0 \\ \hline Total Current Liabilities & $2,134 & $2,198 & & $2,286 & & $2,286 \\ \hline Amount Borrowed from Credit Line & $3,200 & $3,200 & & $3,200 & & $2,899 \\ \hline Total Liabilities & $5,334 & $5,398 & & $5,486 & & $5,185 \\ \hline Common Stock & $200 & $200 & & $200 & & $200 \\ \hline Retained Earnings & $4,348 & $4,943 & & $5,569 & & $6,195 \\ \hline Total Stockholder's Equity & $4,548 & $5,143 & & $5,769 & & $6,395 \\ \hline Total Liabilities \& Equity & $9,882 & $10,542 & & $11,255 & & $11,580 \\ \hline \end{tabular} \begin{tabular}{|c|c|c|c|c|} \hline \multirow{2}{*}{CashFlow(datainthousandsofdollars)} & & \multirow{2}{*}{History2019} & \multirow{2}{*}{Phase12020} & \multirow{2}{*}{Phase32021} \\ \hline & 2018 & & & \\ \hline Net Income & $574 & $596 & $626 & $626 \\ \hline Depreciation & $0 & $0 & $0 & $0 \\ \hline Change in Account Receivable & $277 & $117 & $178 & $0 \\ \hline Change in Inventories & $223 & $194 & $251 & $0 \\ \hline Change in Other CA & $0 & $0 & $0 & $0 \\ \hline Change in Account Payable & $102 & $64 & $88 & $0 \\ \hline Change in Accrued Expenses & $0 & $0 & $0 & $0 \\ \hline Cash Flow from Operations & 175.87 & 348.51 & 285.07 & 626.02 \\ \hline CAPEX & $0 & $0 & $0 & $0 \\ \hline Cash Flow from Investments & $0 & $0 & $0 & $0 \\ \hline Change in Credit Line & $0 & $0 & $0 & $301 \\ \hline Equity Issuance & $0 & $0 & $0 & $0 \\ \hline Dividends & $0 & $0 & $0 & $0 \\ \hline Cash Flow from Financing & $0 & $0 & $0 & $301 \\ \hline Net Cash Flow & $175 & $348 & $285 & $325 \\ \hline Beginning Excess Cash and Cash Equivalents & $1,133 & $957 & $609 & $325 \\ \hline Ending Cash and Equivalents & $957 & $609 & $325 & $0 \\ \hline \end{tabular} \begin{tabular}{|c|c|c|c|c|c|c|} \hline Balance Sheet & & & History & Phase 1 & Phase 2 & Phase 3 \\ \hline (data in thousands of dollars) & 2018 & 2019 & & 2020 & & 2021 \\ \hline Minimum Cash Requirement & $300 & $300 & & $300 & & $300 \\ \hline Cash \& Equivalents (Shortfall)* & $957 & $609 & & $325 & & $0 \\ \hline Accounts Receivable & $5,815 & $5,932 & & $6,110 & & $6,110 \\ \hline Inventories & $4,685 & $4,879 & & $5,130 & & $5,130 \\ \hline Other CA & so & $0 & & so & & $0 \\ \hline Total Current Assets & $9,842 & $10,502 & & $11,215 & & $11,540 \\ \hline Net PP\&E & $40 & $40 & & $40 & & $40 \\ \hline Other FA & so & $0 & & so & & $0 \\ \hline Total Assets & $9,882 & $10,542 & & $11,255 & & $11,580 \\ \hline Accounts Payable & $2,134 & $2,198 & & $2,286 & & $2,286 \\ \hline Accrued Expenses & so & $0 & & so & & $0 \\ \hline Total Current Liabilities & $2,134 & $2,198 & & $2,286 & & $2,286 \\ \hline Amount Borrowed from Credit Line & $3,200 & $3,200 & & $3,200 & & $2,899 \\ \hline Total Liabilities & $5,334 & $5,398 & & $5,486 & & $5,185 \\ \hline Common Stock & $200 & $200 & & $200 & & $200 \\ \hline Retained Earnings & $4,348 & $4,943 & & $5,569 & & $6,195 \\ \hline Total Stockholder's Equity & $4,548 & $5,143 & & $5,769 & & $6,395 \\ \hline Total Liabilities \& Equity & $9,882 & $10,542 & & $11,255 & & $11,580 \\ \hline \end{tabular} \begin{tabular}{|c|c|c|c|c|} \hline \multirow{2}{*}{CashFlow(datainthousandsofdollars)} & & \multirow{2}{*}{History2019} & \multirow{2}{*}{Phase12020} & \multirow{2}{*}{Phase32021} \\ \hline & 2018 & & & \\ \hline Net Income & $574 & $596 & $626 & $626 \\ \hline Depreciation & $0 & $0 & $0 & $0 \\ \hline Change in Account Receivable & $277 & $117 & $178 & $0 \\ \hline Change in Inventories & $223 & $194 & $251 & $0 \\ \hline Change in Other CA & $0 & $0 & $0 & $0 \\ \hline Change in Account Payable & $102 & $64 & $88 & $0 \\ \hline Change in Accrued Expenses & $0 & $0 & $0 & $0 \\ \hline Cash Flow from Operations & 175.87 & 348.51 & 285.07 & 626.02 \\ \hline CAPEX & $0 & $0 & $0 & $0 \\ \hline Cash Flow from Investments & $0 & $0 & $0 & $0 \\ \hline Change in Credit Line & $0 & $0 & $0 & $301 \\ \hline Equity Issuance & $0 & $0 & $0 & $0 \\ \hline Dividends & $0 & $0 & $0 & $0 \\ \hline Cash Flow from Financing & $0 & $0 & $0 & $301 \\ \hline Net Cash Flow & $175 & $348 & $285 & $325 \\ \hline Beginning Excess Cash and Cash Equivalents & $1,133 & $957 & $609 & $325 \\ \hline Ending Cash and Equivalents & $957 & $609 & $325 & $0 \\ \hline \end{tabular}
 Step by Step Solution
There are 3 Steps involved in it
Step: 1

Get Instant Access to Expert-Tailored Solutions
See step-by-step solutions with expert insights and AI powered tools for academic success
Step: 2

Step: 3
Ace Your Homework with AI
Get the answers you need in no time with our AI-driven, step-by-step assistance
Get Started
Tidy Finance With R
Authors: Christoph Scheuch, Stefan Voigt, Patrick Weiss
1st Edition
1032389346, 978-1032389349