Question
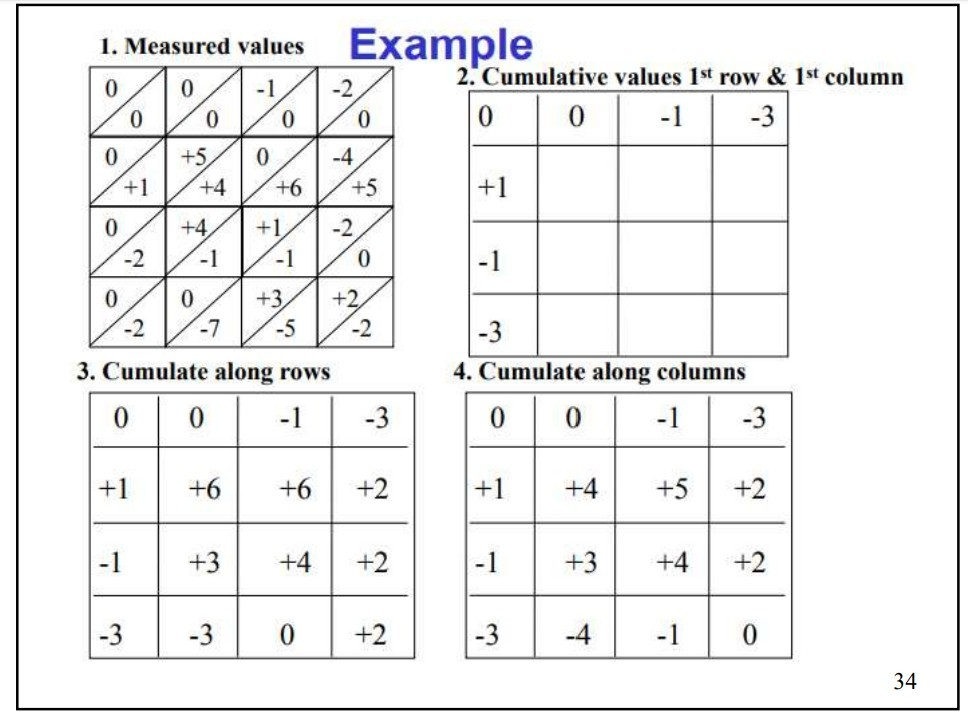
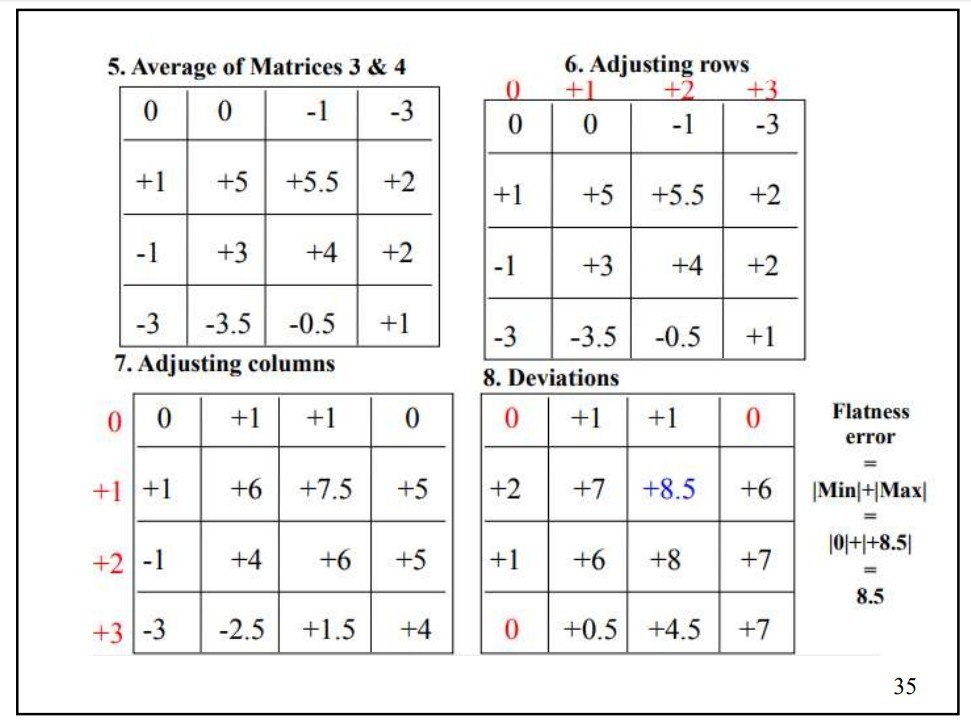
Please look into the attachment for the 'Grid Method' of flatness error measurement of a surface pertaining to the course 'Metrology'. And provide me with
Please look into the attachment for the 'Grid Method' of flatness error measurement of a surface pertaining to the course 'Metrology'. And provide me with the MATLAB or Python program to find the flatness error. In this case, the answer should come as '8.5' when you input the measured values table ( the first table in the example ). While adjusting rows, take a look at the red numbers written on top of the table. Just invert the sign of the first row last element and write above that element ( here we write +3 ). Then divide this number by [number of columns -1] , here it is +3 divided by 3 is equal to +1. Now decrease in steps of +1 and write over the corresponding elements of the first row from right to left ( here we get 0 +1 +2 +3). Now add these numbers to all elements of corresponding columns. Thus row adjustment is done. Proceed in similar way for column adjustment first by making first column last element as zero.
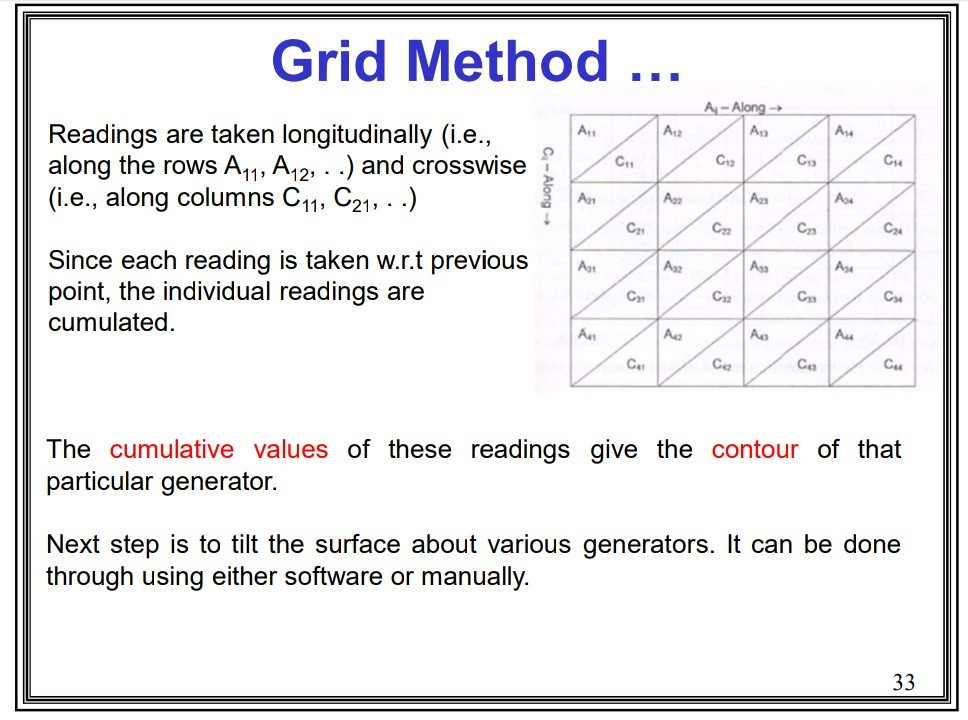
Grid Method A - Along A A12 Readings are taken longitudinally (i.e. along the rows A1, A2, ..) and crosswise (i.e., along columns C11, C21, ...) C12 C, - Along Since each reading is taken w.r.t previous point, the individual readings are cumulated. . The cumulative values of these readings give the contour of that particular generator. Next step is to tilt the surface about various generators. It can be done through using either software or manually. 33 1. Measured values %%%% Example 2. Cumulative values 1st row & 1st column -1 -3 101 3. Cumulate along rows 0 0 -1 -3 4. Cumulate along columns 0 0 -1 -3 +1 +6 +2 +4 +5 +2 +6 +4 -1 +3 +2 +4 +2 -3 0 +2 34 6. Adjusting rows 5. Average of Matrices 3 & 4 0 0 -1 -3 +1 - 0 -1 -3 +1 +5 +5.5 +2 +5 +5.5 -1 +3 +4 +2 1-1 +3 +4 +2 +1 -0.5 +1 | -3 -3.5 -0.5 7. Adjusting columns 0 0 +1 +1 -3.5 8. Deviations +1 0 +1 0 Flatness error +1 +6 +7.5 +5 +7 +8.5 +6 Min +Max 101+1+8.51 +6 +8 +7 8.5 5 + S +0.5 +4.5 +7 35 Grid Method A - Along A A12 Readings are taken longitudinally (i.e. along the rows A1, A2, ..) and crosswise (i.e., along columns C11, C21, ...) C12 C, - Along Since each reading is taken w.r.t previous point, the individual readings are cumulated. . The cumulative values of these readings give the contour of that particular generator. Next step is to tilt the surface about various generators. It can be done through using either software or manually. 33 1. Measured values %%%% Example 2. Cumulative values 1st row & 1st column -1 -3 101 3. Cumulate along rows 0 0 -1 -3 4. Cumulate along columns 0 0 -1 -3 +1 +6 +2 +4 +5 +2 +6 +4 -1 +3 +2 +4 +2 -3 0 +2 34 6. Adjusting rows 5. Average of Matrices 3 & 4 0 0 -1 -3 +1 - 0 -1 -3 +1 +5 +5.5 +2 +5 +5.5 -1 +3 +4 +2 1-1 +3 +4 +2 +1 -0.5 +1 | -3 -3.5 -0.5 7. Adjusting columns 0 0 +1 +1 -3.5 8. Deviations +1 0 +1 0 Flatness error +1 +6 +7.5 +5 +7 +8.5 +6 Min +Max 101+1+8.51 +6 +8 +7 8.5 5 + S +0.5 +4.5 +7 35Step by Step Solution
There are 3 Steps involved in it
Step: 1
Get Instant Access to Expert-Tailored Solutions
See step-by-step solutions with expert insights and AI powered tools for academic success
Step: 2
Step: 3
Ace Your Homework with AI
Get the answers you need in no time with our AI-driven, step-by-step assistance
Get Started