Please make fresh charts to represent the data graphically. Thanks. 2-29. Boston Properties is a real estate investment trust (REIT) that owns first-class office properties
Please make fresh charts to represent the data graphically. Thanks.
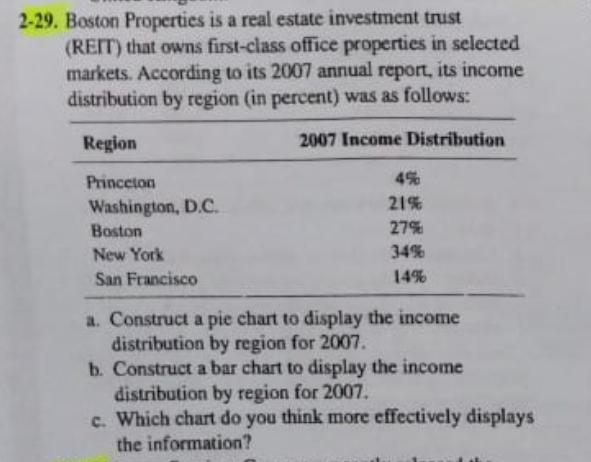
2-29. Boston Properties is a real estate investment trust (REIT) that owns first-class office properties in selected markets. According to its 2007 annual report, its income distribution by region (in percent) was as follows: Region 2007 Income Distribution Princeton 4% Washington, D.C. 21% Boston 27% New York 34% San Francisco 14% a. Construct a pie chart to display the income distribution by region for 2007. b. Construct a bar chart to display the income distribution by region for 2007. c. Which chart do you think more effectively displays the information?
Step by Step Solution
There are 3 Steps involved in it
Step: 1
i am attaching the answer of first tw...
See step-by-step solutions with expert insights and AI powered tools for academic success
Step: 2

Step: 3

Ace Your Homework with AI
Get the answers you need in no time with our AI-driven, step-by-step assistance
Get Started


