

Answered step by step
Verified Expert Solution
Question
1 Approved Answer
PLEASE make Future Cash Flow Projections with information below: Income Statement Currency in EUR. All numbers in thousands Get access to 15+ years of historical
PLEASE make Future Cash Flow Projections with information below: 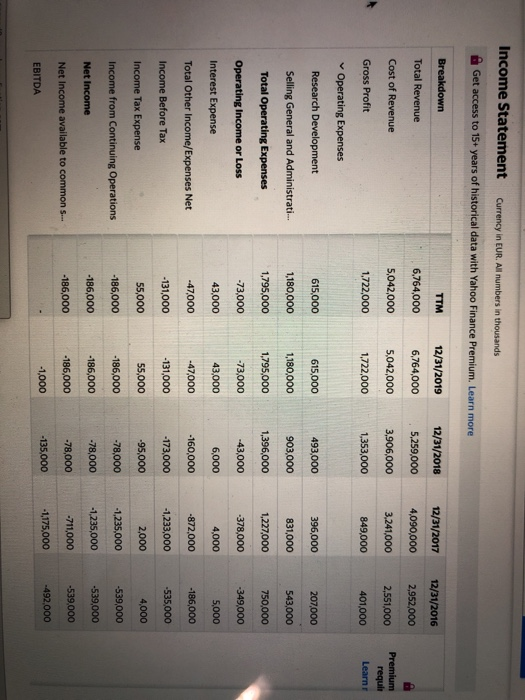

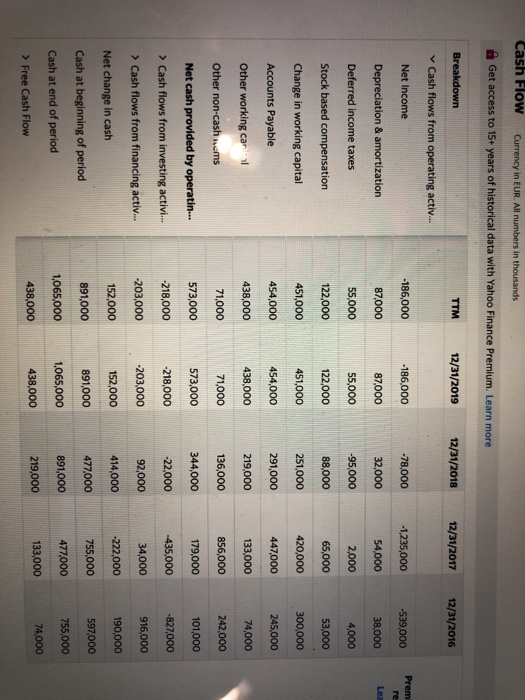
Income Statement Currency in EUR. All numbers in thousands Get access to 15+ years of historical data with Yahoo Finance Premium. Learn more Breakdown 12/31/2017 12/31/2019 6,764,000 12/31/2016 12/31/2018 5,259,000 Total Revenue 4,090,000 2,952,000 TTM 6,764,000 5,042,000 1,722,000 Cost of Revenue 5,042,000 3,906,000 3,241,000 2,551,000 401,000 Premium requin Learn Gross Profit 1,722,000 1,353,000 849,000 Operating Expenses Research Development 615,000 396,000 207,000 615,000 1,180,000 Selling General and Administrati... 543,000 Total Operating Expenses 1,180,000 1,795,000 -73,000 1,795,000 750,000 493,000 903,000 1,396,000 -43,000 6,000 -160,000 831,000 1,227,000 -378,000 4,000 Operating Income or Loss -73,000 Interest Expense 43,000 43,000 -349,000 5,000 -186,000 Total Other Income/Expenses Net - 47,000 -47,000 -872,000 Income Before Tax -131,000 -131,000 -1,233,000 -535,000 -173,000 -95,000 Income Tax Expense 55,000 55,000 2,000 Income from Continuing Operations -186,000 -186,000 -78,000 -1.235,000 -1,235,000 -186,000 Net Income -186,000 4,000 -539,000 -539,000 -539,000 -492,000 -78,000 -186,000 -186,000 -78,000 Net Income available to common S... -711,000 -1,000 EBITDA -1,175,000 -135,000 Limited time only. Open an acce Show: Income Statement Balance Sheet Cash Flow Balance Sheet Currency in EUR. All numbers in thousands Get access to 15+ years of historical data with Yahoo Finance Premium. Learn more Breakdown 12/31/2019 12/31/2018 12/31/2017 12/31/2016 Assets > Current Assets 2,231,000 2,246,000 1,898,000 1,909,000 Pr > Non-current ssets 2,891,000 2,090,000 1,209,000 191,000 Total Assets 5,122,000 4,336,000 3,107,000 2,100,000 Liabilities and stockholders' eq... > Liabilities 3,085,000 2,242,000 1,925,000 2,340,000 > Stockholders' Equity 2,037,000 2,094,000 1,182,000 -240,000 Total liabilities and stockholde... 5,122,000 4,336,000 3,107,000 2,100,000 Cash Flow Currency in EUR. All numbers in thousands Get access to 15+ years of historical data with Yahoo Finance Premium. Learn more Breakdown TTM 12/31/2019 12/31/2018 12/31/2017 12/31/2016 Cash flows from operating activ... Net Income -186,000 -186,000 -78,000 -1,235,000 -539,000 Prem Depreciation & amortization 54,000 38,000 Les 87.000 55,000 Deferred income taxes 2,000 4,000 87,000 55,000 122,000 451,000 Stock based compensation 122,000 32,000 -95,000 88,000 251,000 291,000 65,000 53,000 Change in working capital 451,000 420,000 300,000 Accounts Payable 454,000 454,000 447,000 245,000 Other working car al 438,000 438,000 133,000 74,000 219,000 136,000 Other non-cash.cms 71,000 71,000 856,000 242,000 Net cash provided by operatin... 573,000 573,000 344,000 101,000 179,000 > Cash flows from investing activi... -218,000 -218,000 -22,000 -435,000 -827,000 916,000 > Cash flows from financing activ... -203,000 92,000 34,000 152,000 Net change in cash 414,000 -222,000 190,000 891,000 -203,000 152,000 891,000 1,065,000 438,000 477,000 Cash at beginning of period 755,000 597,000 891,000 477,000 755,000 Cash at end of period 1,065,000 438,000 219,000 133,000 74,000 > Free Cash Flow Income Statement Currency in EUR. All numbers in thousands Get access to 15+ years of historical data with Yahoo Finance Premium. Learn more Breakdown 12/31/2017 12/31/2019 6,764,000 12/31/2016 12/31/2018 5,259,000 Total Revenue 4,090,000 2,952,000 TTM 6,764,000 5,042,000 1,722,000 Cost of Revenue 5,042,000 3,906,000 3,241,000 2,551,000 401,000 Premium requin Learn Gross Profit 1,722,000 1,353,000 849,000 Operating Expenses Research Development 615,000 396,000 207,000 615,000 1,180,000 Selling General and Administrati... 543,000 Total Operating Expenses 1,180,000 1,795,000 -73,000 1,795,000 750,000 493,000 903,000 1,396,000 -43,000 6,000 -160,000 831,000 1,227,000 -378,000 4,000 Operating Income or Loss -73,000 Interest Expense 43,000 43,000 -349,000 5,000 -186,000 Total Other Income/Expenses Net - 47,000 -47,000 -872,000 Income Before Tax -131,000 -131,000 -1,233,000 -535,000 -173,000 -95,000 Income Tax Expense 55,000 55,000 2,000 Income from Continuing Operations -186,000 -186,000 -78,000 -1.235,000 -1,235,000 -186,000 Net Income -186,000 4,000 -539,000 -539,000 -539,000 -492,000 -78,000 -186,000 -186,000 -78,000 Net Income available to common S... -711,000 -1,000 EBITDA -1,175,000 -135,000 Limited time only. Open an acce Show: Income Statement Balance Sheet Cash Flow Balance Sheet Currency in EUR. All numbers in thousands Get access to 15+ years of historical data with Yahoo Finance Premium. Learn more Breakdown 12/31/2019 12/31/2018 12/31/2017 12/31/2016 Assets > Current Assets 2,231,000 2,246,000 1,898,000 1,909,000 Pr > Non-current ssets 2,891,000 2,090,000 1,209,000 191,000 Total Assets 5,122,000 4,336,000 3,107,000 2,100,000 Liabilities and stockholders' eq... > Liabilities 3,085,000 2,242,000 1,925,000 2,340,000 > Stockholders' Equity 2,037,000 2,094,000 1,182,000 -240,000 Total liabilities and stockholde... 5,122,000 4,336,000 3,107,000 2,100,000 Cash Flow Currency in EUR. All numbers in thousands Get access to 15+ years of historical data with Yahoo Finance Premium. Learn more Breakdown TTM 12/31/2019 12/31/2018 12/31/2017 12/31/2016 Cash flows from operating activ... Net Income -186,000 -186,000 -78,000 -1,235,000 -539,000 Prem Depreciation & amortization 54,000 38,000 Les 87.000 55,000 Deferred income taxes 2,000 4,000 87,000 55,000 122,000 451,000 Stock based compensation 122,000 32,000 -95,000 88,000 251,000 291,000 65,000 53,000 Change in working capital 451,000 420,000 300,000 Accounts Payable 454,000 454,000 447,000 245,000 Other working car al 438,000 438,000 133,000 74,000 219,000 136,000 Other non-cash.cms 71,000 71,000 856,000 242,000 Net cash provided by operatin... 573,000 573,000 344,000 101,000 179,000 > Cash flows from investing activi... -218,000 -218,000 -22,000 -435,000 -827,000 916,000 > Cash flows from financing activ... -203,000 92,000 34,000 152,000 Net change in cash 414,000 -222,000 190,000 891,000 -203,000 152,000 891,000 1,065,000 438,000 477,000 Cash at beginning of period 755,000 597,000 891,000 477,000 755,000 Cash at end of period 1,065,000 438,000 219,000 133,000 74,000 > Free Cash Flow
Step by Step Solution
There are 3 Steps involved in it
Step: 1

Get Instant Access to Expert-Tailored Solutions
See step-by-step solutions with expert insights and AI powered tools for academic success
Step: 2

Step: 3
Ace Your Homework with AI
Get the answers you need in no time with our AI-driven, step-by-step assistance
Get Started
Finance The Basics
Authors: Erik Banks
3rd Edition
1138919780, 9781138919785