

Question: Please make sure it is working. You can use any image as long as the outcome is the same. ECE 72 (50pts) Project 1: Digital
Please make sure it is working. You can use any image as long as the outcome is the same.
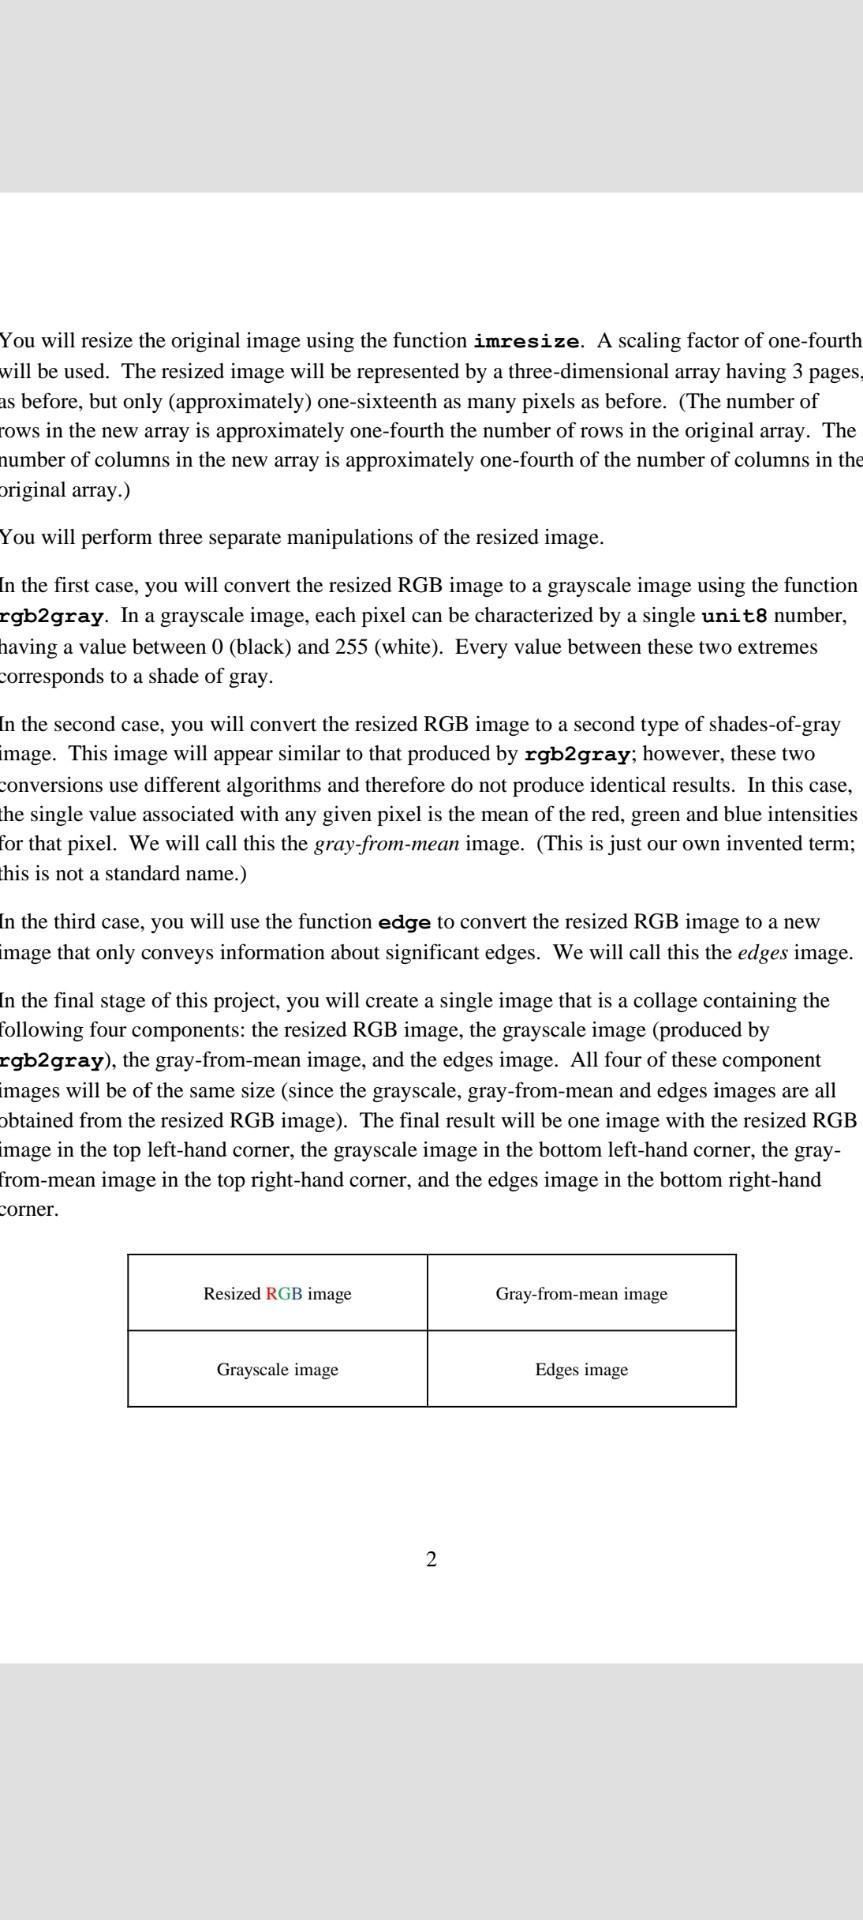
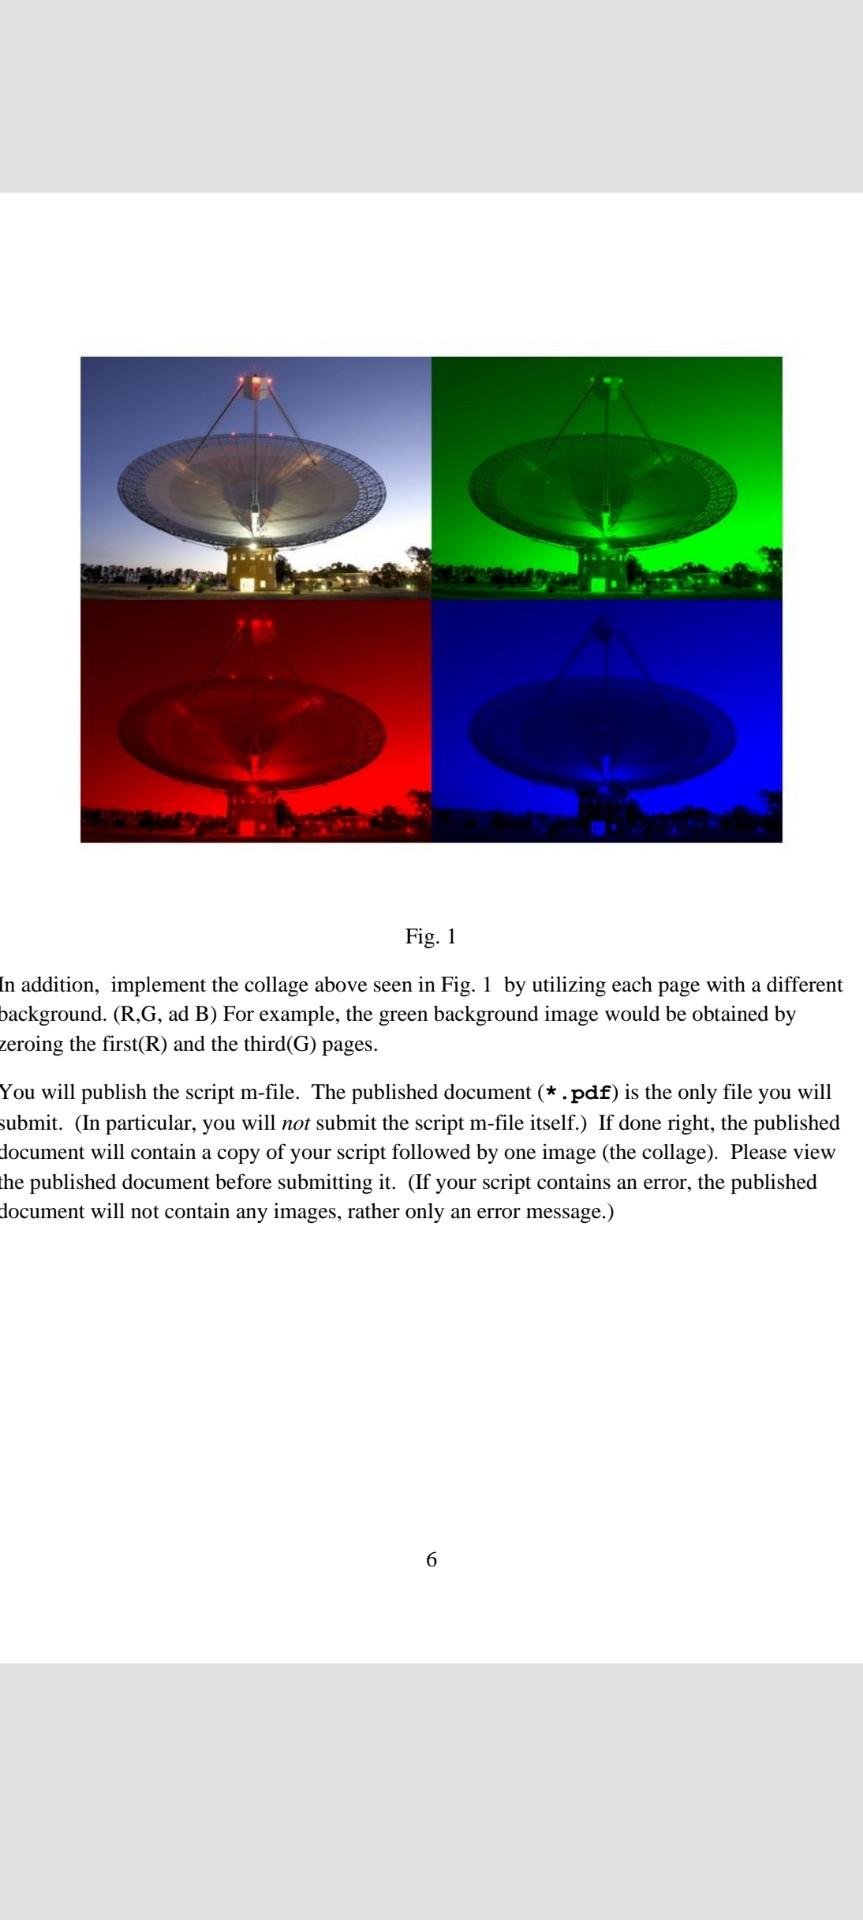
ECE 72 (50pts) Project 1: Digital Image Processing The file Parkes.png is available on Canvas. This file contains an image stored in Portable Network Graphics (PNG) format. You are to write a MATLAB script that builds from this image a more complicated image. This set of notes contains a description of what you will be accomplishing with this project, followed by more specific instructions on how you will accomplish this project. For this project you will need a copy of MATLAB that has the Image Processing Toolbox. You will be using the following functions in this toolbox: imresize, edge, rgb2gray, and imshow. All copies of MATLAB software in ECE departmental computers have the image Processing Toolbox. The student version of MATLAB sold by MathWorks also has the Image Processing Toolbox. This is an individual project. You may discuss this project with other classmates. But your submissions must be the fruit of your own labor. Description of Project The file Parkes.png contains a picture of the Parkes Observatory, a radio telescope in Parkes, New South Wales, Australia. This large antenna is used for radio astronomy. It was also used in 1969 to receive from the moon the signal from the TV camera on the Apollo 11 Lunar Module, enabling live TV broadcast of the first moon walk. The image in Parkes.png employs the additive primary colors: red, green and blue. This is known as an RGB image. You will use the function imread to read Parkes.png. All the information of the RGB image is placed by imread within one three-dimensional array in the MATLAB workspace. This array consists of three matrices. The first matrix contains the red intensities of the image pixels; this is also known as the first page of the three-dimensional array. The second matrix (the second page of the three-dimensional array) contains the green intensities. Finally, the third page contains the blue siti For example, if the ree- dimensional array produced by imread is named A, the value A (5,9,1) is the red intensity for the pixel in the fifth row and ninth column. The values A (5,9,2) and A (5,9,3) are the green and blue intensities, respectively, for that same pixel. All intensities are stored as uint8 numbers. This means that each intensity is stored in one byte (a group of eight bits) as an unsigned integer between 0 and 255, inclusive. 1 You will resize the original image using the function imresize. A scaling factor of one-fourth will be used. The resized image will be represented by a three-dimensional array having 3 pages, as before, but only (approximately) one-sixteenth as many pixels as before. (The number of rows in the new array is approximately one-fourth the number of rows in the original array. The number of columns in the new array is approximately one-fourth of the number of columns in the original array.) You will perform three separate manipulations of the resized image. In the first case, you will convert the resized RGB image to a grayscale image using the function rgb2gray. In a grayscale image, each pixel can be characterized by a single unit8 number, having a value between 0 (black) and 255 (white). Every value between these two extremes corresponds to a shade of gray. In the second case, you will convert the resized RGB image to a second type of shades-of-gray image. This image will appear similar to that produced by rgb2gray; however, these two conversions use different algorithms and therefore not produce identical results. In this case, the single value associated with any given pixel is the mean of the red, green and blue intensities for that pixel. We will call this the gray-from-mean image. (This is just our own invented term; this is not a standard name.) In the third case, you will use the function edge to convert the resized RGB image to a new image that only conveys information about significant edges. We will call this the edges image. In the final stage of this project, you will create a single image that is a collage containing the following four components: the resized RGB image, the grayscale image (produced by rgb2gray), the gray-from-mean image, and the edges image. All four of these component images will be of the same size (since the grayscale, gray-from-mean and edges images are all obtained from the resized RGB image). The final result will be one image with the resized RGB image in the top left-hand corner, the grayscale image in the bottom left-hand corner, the gray- from-mean image in the top right-hand corner, and the edges image in the bottom right-hand corner. Resized RGB image Gray-from-mean image Grayscale image Edges image 2 The final (collage) image will have twice as many rows and twice as many columns as the resized RGB component image. This final image will be an RGB image since the top left-hand corner of this image will contain the resized RGB component image. Therefore, this final image will be represented by a three-dimensional array, having a page 1 (red intensities), a page 2 (green intensities) and a page 3 (blue intensities). Three of the component images (grayscale, gray-from-mean, and edges) do not require three intensity numbers to characterize a pixel. In fact, when created (using the rgb2gray, mean or edge functions) each of these images will be characterized by a single two-dimensional array (matrix). Therefore, before the final (collage) image can be assembled, you will have to convert each two-dimensional image array to a three-dimensional image array. This can be done by copying a single two-dimensional array (matrix) into pages 1, 2 and 3 of a three-dimensional array. This makes the red, green and blue intensities of each pixel the same. (Of course, the intensity will, in general, be different from one pixel to the next.) This results in each pixel appearing black (intensity = 0), white (intensity = 255) or a shade of gray (0 Mathematics > Statistics and Random Numbers > Descriptive Statistics). You will use mean in the form M=mean (A, dim), where A is a three-dimensional array and dim is an integer. The function mean produces numbers of class double. You want the gray-from-mean image array to store (gray) intensity numbers as one-byte unsigned integers (ranging from 0 to 255, inclusive). Therefore, you must convert the element values produced by the function mean using the uint8 function. You can view image arrays using imshow. If you view the grayscale image and the gray-from- mean image, you will see that they look similar. This is not surprising since both images were produced by converting the same (resized) RGB image to shades-of-gray. However, if you look closely, you should notice that these two images are not identical. If you look at a few example (gray) intensity values in the grayscale and gray-from-mean arrays, you should notice that the numbers corresponding to any given pixel are typically not identical. You will convert the grayscale image to an edges image using edge with the 'sobel' method. The function edge expects a two-dimensional array (matrix) as its first input argument; this is why you are using the grayscale image array, rather than an RGB image array, as the input to edge. Use size and class to determine the important properties of the resulting array. You will see that elements in the resulting array are not of class uint8. This has to be fixed. You can fix this by using the function unit8 followed by a multiplication by 255. If you want to find the maximum and minimum values in a matrix named X, this is easily accomplished with the commands max (X(:)) and min (X(:)). (If you don't unroll X into a single column using the colon operator before applying the max or min function, you will get a huge row vector containing maximums or minimums of the individual columns of the array X.) You will assemble the four images described above into a collage, as discussed in the section Description of Project. The resized RGB image array is already in the right format for placement in the collage image. However, the three edited image arrays (grayscale, gray-from- mean, and edges) need to be rewritten as three-dimensional arrays before they can be placed in the collage image. You can take a two-dimensional array (matrix) representing a shades-of-gray image and rewrite it as a three-dimensional array (with three pages, one for each of the three additive primary colors) using the function cat. (Hint: You will use cat with four input arguments. The first is the dimension along which the concatenation is to take place. The second, third and fourth input arguments will be the same: the matrix to be copied.) 4 Before assembling the four images into a collage, you should pre-allocate memory for the three- dimensional array that will hold the collage image. Is this absolutely necessary? No. But it is good programming practice. The collage image will require a big array, consuming a lot of memory; and it is efficient to make the necessary memory allocation all at once, rather than piecemeal. Your script will need to know how many rows, columns and pages the new collage array must have. Of course, the number of pages is 3 (one for each of the three additive primary colors). The number of rows in the collage matrix will equal twice the number of rows in the resized RGB array. The number of columns in the collage matrix will equal twice the number of columns in the resized RGB array. You can, of course, get those numbers from the MATLAB workspace. But, as a matter of good programming practice, you shouldn't hard-code those numbers into your script. (If you did that, then your script would only work for images of a certain size.) Instead, you should have your script discover for itself the necessary dimensions by use of the size function (followed by a doubling). One of your goals should be that your script can be reused with other images (not necessarily of the same size), with only a change in filename. You can do the pre-allocation with zeros. You will want to specify the classname 'uint8' (as the last input argument) when calling zeros; this will cause an array to be created for which the elements are one-byte unsigned integers. (By default, zeros creates arrays of doubles.) Now you are ready to place the four component images in the collage. You can accomplish this with the colon operator. For example, if you had a three-dimensional array x that you wanted to place in the larger three-dimensional array Y such that the image of X goes into the top left-hand corner of y, you could do this: Y(1:m, 1:n, :) = x; where m is the number of rows in X and n is the number of columns in X. (Presumably, both X and Y have 3 pages.) Don't hard-code values for m and n. Your script should have MATLAB calculate these integers. You can display the final collage image using imshow. It is now time to put the most important stuff into a single script m-file. This script should produce the collage described above. In other words, this script m-file will start with imread, which reads Parkes.png, and end with imshow, which displays the collage image. You will only have one imshow in this script m-file. (You don't need to show the individual component images in your submission.) Also, you don't need this script to print out the size and class properties of the arrays. (You needed to see those properties for your own understanding, but these values need not appear in your submission.) 5 Fig. 1 In addition, implement the collage above seen in Fig. 1 by utilizing each page with a different background. (R,G, ad B) For example, the green background image would be obtained by zeroing the first(R) and the third(G) pages. You will publish the script m-file. The published document (*.pdf) is the only file you will submit. (In particular, you will not submit the script m-file itself.) If done right, the published document will contain a copy of your script followed by one image (the collage). Please view the published document before submitting it. (If your script contains an error, the published Hocument will not contain any images, rather only an error message.) 6 ECE 72 (50pts) Project 1: Digital Image Processing The file Parkes.png is available on Canvas. This file contains an image stored in Portable Network Graphics (PNG) format. You are to write a MATLAB script that builds from this image a more complicated image. This set of notes contains a description of what you will be accomplishing with this project, followed by more specific instructions on how you will accomplish this project. For this project you will need a copy of MATLAB that has the Image Processing Toolbox. You will be using the following functions in this toolbox: imresize, edge, rgb2gray, and imshow. All copies of MATLAB software in ECE departmental computers have the image Processing Toolbox. The student version of MATLAB sold by MathWorks also has the Image Processing Toolbox. This is an individual project. You may discuss this project with other classmates. But your submissions must be the fruit of your own labor. Description of Project The file Parkes.png contains a picture of the Parkes Observatory, a radio telescope in Parkes, New South Wales, Australia. This large antenna is used for radio astronomy. It was also used in 1969 to receive from the moon the signal from the TV camera on the Apollo 11 Lunar Module, enabling live TV broadcast of the first moon walk. The image in Parkes.png employs the additive primary colors: red, green and blue. This is known as an RGB image. You will use the function imread to read Parkes.png. All the information of the RGB image is placed by imread within one three-dimensional array in the MATLAB workspace. This array consists of three matrices. The first matrix contains the red intensities of the image pixels; this is also known as the first page of the three-dimensional array. The second matrix (the second page of the three-dimensional array) contains the green intensities. Finally, the third page contains the blue siti For example, if the ree- dimensional array produced by imread is named A, the value A (5,9,1) is the red intensity for the pixel in the fifth row and ninth column. The values A (5,9,2) and A (5,9,3) are the green and blue intensities, respectively, for that same pixel. All intensities are stored as uint8 numbers. This means that each intensity is stored in one byte (a group of eight bits) as an unsigned integer between 0 and 255, inclusive. 1 You will resize the original image using the function imresize. A scaling factor of one-fourth will be used. The resized image will be represented by a three-dimensional array having 3 pages, as before, but only (approximately) one-sixteenth as many pixels as before. (The number of rows in the new array is approximately one-fourth the number of rows in the original array. The number of columns in the new array is approximately one-fourth of the number of columns in the original array.) You will perform three separate manipulations of the resized image. In the first case, you will convert the resized RGB image to a grayscale image using the function rgb2gray. In a grayscale image, each pixel can be characterized by a single unit8 number, having a value between 0 (black) and 255 (white). Every value between these two extremes corresponds to a shade of gray. In the second case, you will convert the resized RGB image to a second type of shades-of-gray image. This image will appear similar to that produced by rgb2gray; however, these two conversions use different algorithms and therefore not produce identical results. In this case, the single value associated with any given pixel is the mean of the red, green and blue intensities for that pixel. We will call this the gray-from-mean image. (This is just our own invented term; this is not a standard name.) In the third case, you will use the function edge to convert the resized RGB image to a new image that only conveys information about significant edges. We will call this the edges image. In the final stage of this project, you will create a single image that is a collage containing the following four components: the resized RGB image, the grayscale image (produced by rgb2gray), the gray-from-mean image, and the edges image. All four of these component images will be of the same size (since the grayscale, gray-from-mean and edges images are all obtained from the resized RGB image). The final result will be one image with the resized RGB image in the top left-hand corner, the grayscale image in the bottom left-hand corner, the gray- from-mean image in the top right-hand corner, and the edges image in the bottom right-hand corner. Resized RGB image Gray-from-mean image Grayscale image Edges image 2 The final (collage) image will have twice as many rows and twice as many columns as the resized RGB component image. This final image will be an RGB image since the top left-hand corner of this image will contain the resized RGB component image. Therefore, this final image will be represented by a three-dimensional array, having a page 1 (red intensities), a page 2 (green intensities) and a page 3 (blue intensities). Three of the component images (grayscale, gray-from-mean, and edges) do not require three intensity numbers to characterize a pixel. In fact, when created (using the rgb2gray, mean or edge functions) each of these images will be characterized by a single two-dimensional array (matrix). Therefore, before the final (collage) image can be assembled, you will have to convert each two-dimensional image array to a three-dimensional image array. This can be done by copying a single two-dimensional array (matrix) into pages 1, 2 and 3 of a three-dimensional array. This makes the red, green and blue intensities of each pixel the same. (Of course, the intensity will, in general, be different from one pixel to the next.) This results in each pixel appearing black (intensity = 0), white (intensity = 255) or a shade of gray (0 Mathematics > Statistics and Random Numbers > Descriptive Statistics). You will use mean in the form M=mean (A, dim), where A is a three-dimensional array and dim is an integer. The function mean produces numbers of class double. You want the gray-from-mean image array to store (gray) intensity numbers as one-byte unsigned integers (ranging from 0 to 255, inclusive). Therefore, you must convert the element values produced by the function mean using the uint8 function. You can view image arrays using imshow. If you view the grayscale image and the gray-from- mean image, you will see that they look similar. This is not surprising since both images were produced by converting the same (resized) RGB image to shades-of-gray. However, if you look closely, you should notice that these two images are not identical. If you look at a few example (gray) intensity values in the grayscale and gray-from-mean arrays, you should notice that the numbers corresponding to any given pixel are typically not identical. You will convert the grayscale image to an edges image using edge with the 'sobel' method. The function edge expects a two-dimensional array (matrix) as its first input argument; this is why you are using the grayscale image array, rather than an RGB image array, as the input to edge. Use size and class to determine the important properties of the resulting array. You will see that elements in the resulting array are not of class uint8. This has to be fixed. You can fix this by using the function unit8 followed by a multiplication by 255. If you want to find the maximum and minimum values in a matrix named X, this is easily accomplished with the commands max (X(:)) and min (X(:)). (If you don't unroll X into a single column using the colon operator before applying the max or min function, you will get a huge row vector containing maximums or minimums of the individual columns of the array X.) You will assemble the four images described above into a collage, as discussed in the section Description of Project. The resized RGB image array is already in the right format for placement in the collage image. However, the three edited image arrays (grayscale, gray-from- mean, and edges) need to be rewritten as three-dimensional arrays before they can be placed in the collage image. You can take a two-dimensional array (matrix) representing a shades-of-gray image and rewrite it as a three-dimensional array (with three pages, one for each of the three additive primary colors) using the function cat. (Hint: You will use cat with four input arguments. The first is the dimension along which the concatenation is to take place. The second, third and fourth input arguments will be the same: the matrix to be copied.) 4 Before assembling the four images into a collage, you should pre-allocate memory for the three- dimensional array that will hold the collage image. Is this absolutely necessary? No. But it is good programming practice. The collage image will require a big array, consuming a lot of memory; and it is efficient to make the necessary memory allocation all at once, rather than piecemeal. Your script will need to know how many rows, columns and pages the new collage array must have. Of course, the number of pages is 3 (one for each of the three additive primary colors). The number of rows in the collage matrix will equal twice the number of rows in the resized RGB array. The number of columns in the collage matrix will equal twice the number of columns in the resized RGB array. You can, of course, get those numbers from the MATLAB workspace. But, as a matter of good programming practice, you shouldn't hard-code those numbers into your script. (If you did that, then your script would only work for images of a certain size.) Instead, you should have your script discover for itself the necessary dimensions by use of the size function (followed by a doubling). One of your goals should be that your script can be reused with other images (not necessarily of the same size), with only a change in filename. You can do the pre-allocation with zeros. You will want to specify the classname 'uint8' (as the last input argument) when calling zeros; this will cause an array to be created for which the elements are one-byte unsigned integers. (By default, zeros creates arrays of doubles.) Now you are ready to place the four component images in the collage. You can accomplish this with the colon operator. For example, if you had a three-dimensional array x that you wanted to place in the larger three-dimensional array Y such that the image of X goes into the top left-hand corner of y, you could do this: Y(1:m, 1:n, :) = x; where m is the number of rows in X and n is the number of columns in X. (Presumably, both X and Y have 3 pages.) Don't hard-code values for m and n. Your script should have MATLAB calculate these integers. You can display the final collage image using imshow. It is now time to put the most important stuff into a single script m-file. This script should produce the collage described above. In other words, this script m-file will start with imread, which reads Parkes.png, and end with imshow, which displays the collage image. You will only have one imshow in this script m-file. (You don't need to show the individual component images in your submission.) Also, you don't need this script to print out the size and class properties of the arrays. (You needed to see those properties for your own understanding, but these values need not appear in your submission.) 5 Fig. 1 In addition, implement the collage above seen in Fig. 1 by utilizing each page with a different background. (R,G, ad B) For example, the green background image would be obtained by zeroing the first(R) and the third(G) pages. You will publish the script m-file. The published document (*.pdf) is the only file you will submit. (In particular, you will not submit the script m-file itself.) If done right, the published document will contain a copy of your script followed by one image (the collage). Please view the published document before submitting it. (If your script contains an error, the published Hocument will not contain any images, rather only an error message.) 6
Step by Step Solution
There are 3 Steps involved in it
To solve this project in MATLAB you will need to write a script that follows these steps StepbyStep ... View full answer

Get step-by-step solutions from verified subject matter experts