Question: Please no C++ only C program that will be accepted. Please use two one-dimensional arrays otherwise, it would not be accepted Please see example program


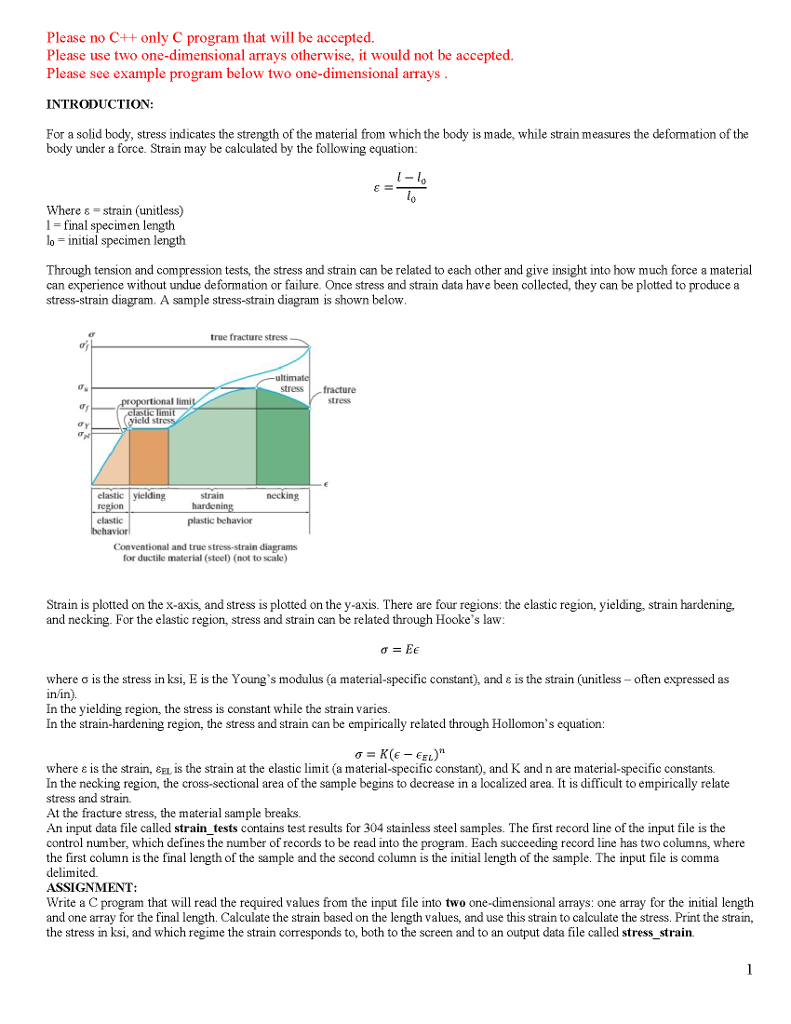
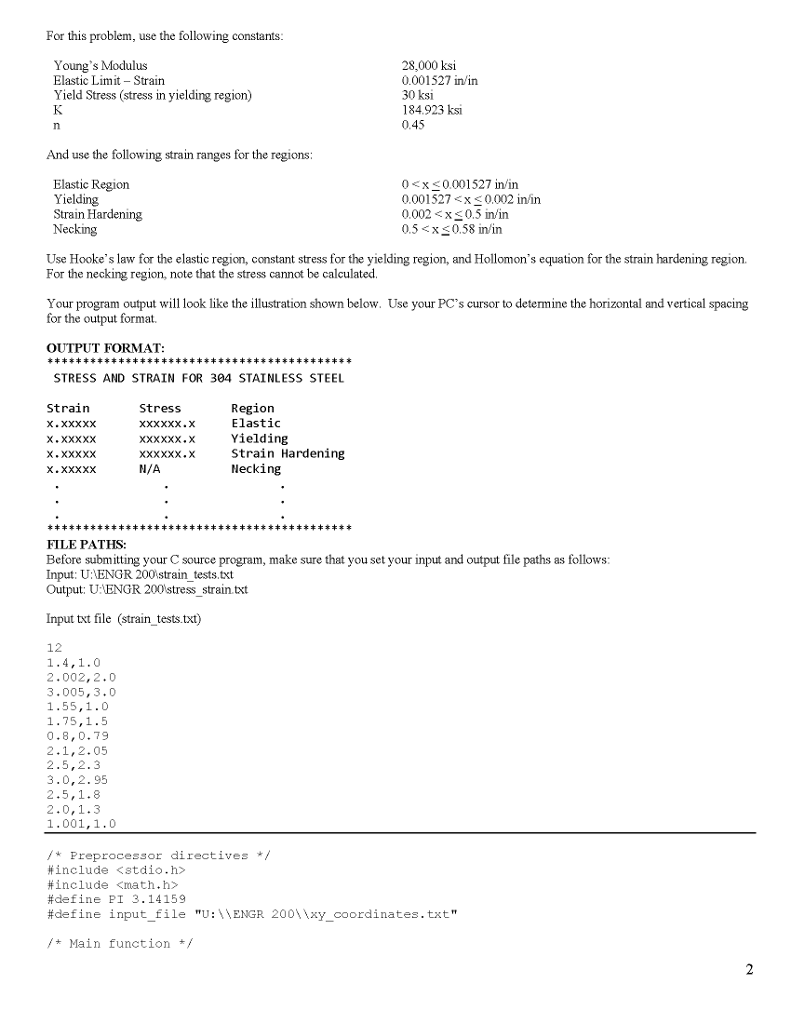
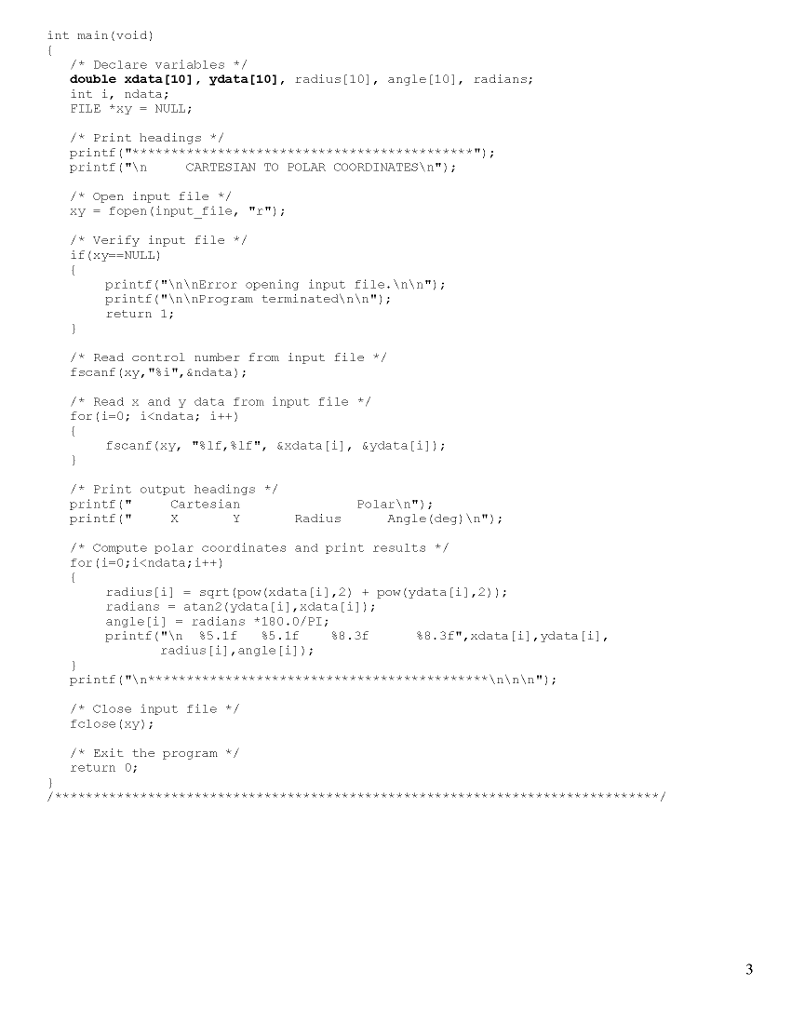
Please no C++ only C program that will be accepted. Please use two one-dimensional arrays otherwise, it would not be accepted Please see example program below two one-dimensional arrays INTRODUCTION For a solid body, stress indicates the strength of the material from which the body is made, while strain measures the deformation of the body under a force. Strain may be calculated by the following equation lo Where s-strain (unitless) 1 = final specimen length lo- initial specimen length Through tension and compression tests, the stress and strain can be related to each other and give insight into how much force a material can experience without undue deformation or failure. Once stress and strain data have been collected, they can be plotted to producea stress-strain diagram. A sample stress-strain diagram is shown below true fracture stress aj stress fracture portional limi stress elastic yielding strain necking elastic plastic behavior Conventional and true stress-strain diagrams for ductile material (steel) (not to scale) Strain is plotted on the x-axis, and stress is plotted on the y-axis. There are four regions: the elastic region, yielding, strain hardening. and necking. For the elastic region, stress and strain can be related through Hooke's law: where is the stress in ksi, E is the Young's modulus a material-specific constant, and s the strain (unitless-often expressed as in/in). In the yielding region, the stress is constant while the strain varies. In the strain-hardening region, the stress and strain can be empirically related through Hollomon's equation: where is the strain, is the strain at the elastic limit (a material-specific constant, and K and n are material-specific constants. In the necking region, the cross-sectional area of the sample begins to decrease in a localized area. It is difficult to empirically relate stress and strain. At the fracture stress, the material sample breaks. An input data file called strain tests contains test results for 304 stainless steel samples. The first record line of the input file is the control number, which defines the number of records to be read into the program. Each succeeding record line has two columns, where the first column is the final length of the sample and the second column is the initial length of the sample. The input file is comma delimited. ASSIGNMENT: Write a C program that will read the required values from the input file into two one-dimensional arrays: one array for the initial length and one array for the final length. Calculate the strain based on the length values, and use this strain to calculate the stress. Print the strain, the stress in ksi, and which regime the strain corresponds to, both to the screen and to an output data file called stress strain. Please no C++ only C program that will be accepted. Please use two one-dimensional arrays otherwise, it would not be accepted Please see example program below two one-dimensional arrays INTRODUCTION For a solid body, stress indicates the strength of the material from which the body is made, while strain measures the deformation of the body under a force. Strain may be calculated by the following equation lo Where s-strain (unitless) 1 = final specimen length lo- initial specimen length Through tension and compression tests, the stress and strain can be related to each other and give insight into how much force a material can experience without undue deformation or failure. Once stress and strain data have been collected, they can be plotted to producea stress-strain diagram. A sample stress-strain diagram is shown below true fracture stress aj stress fracture portional limi stress elastic yielding strain necking elastic plastic behavior Conventional and true stress-strain diagrams for ductile material (steel) (not to scale) Strain is plotted on the x-axis, and stress is plotted on the y-axis. There are four regions: the elastic region, yielding, strain hardening. and necking. For the elastic region, stress and strain can be related through Hooke's law: where is the stress in ksi, E is the Young's modulus a material-specific constant, and s the strain (unitless-often expressed as in/in). In the yielding region, the stress is constant while the strain varies. In the strain-hardening region, the stress and strain can be empirically related through Hollomon's equation: where is the strain, is the strain at the elastic limit (a material-specific constant, and K and n are material-specific constants. In the necking region, the cross-sectional area of the sample begins to decrease in a localized area. It is difficult to empirically relate stress and strain. At the fracture stress, the material sample breaks. An input data file called strain tests contains test results for 304 stainless steel samples. The first record line of the input file is the control number, which defines the number of records to be read into the program. Each succeeding record line has two columns, where the first column is the final length of the sample and the second column is the initial length of the sample. The input file is comma delimited. ASSIGNMENT: Write a C program that will read the required values from the input file into two one-dimensional arrays: one array for the initial length and one array for the final length. Calculate the strain based on the length values, and use this strain to calculate the stress. Print the strain, the stress in ksi, and which regime the strain corresponds to, both to the screen and to an output data file called stress strain
Step by Step Solution
There are 3 Steps involved in it

Get step-by-step solutions from verified subject matter experts


