Please only right anwsers last 6 people gave me wrong anwsers and this is the last chance I have to anwser it right please. there
Please only right anwsers last 6 people gave me wrong anwsers and this is the last chance I have to anwser it right please. there is 5 posts. I need all anwsers to all questions posted, GODBLESS. I will be here in every other minute just to make sure questions are posted clearly.
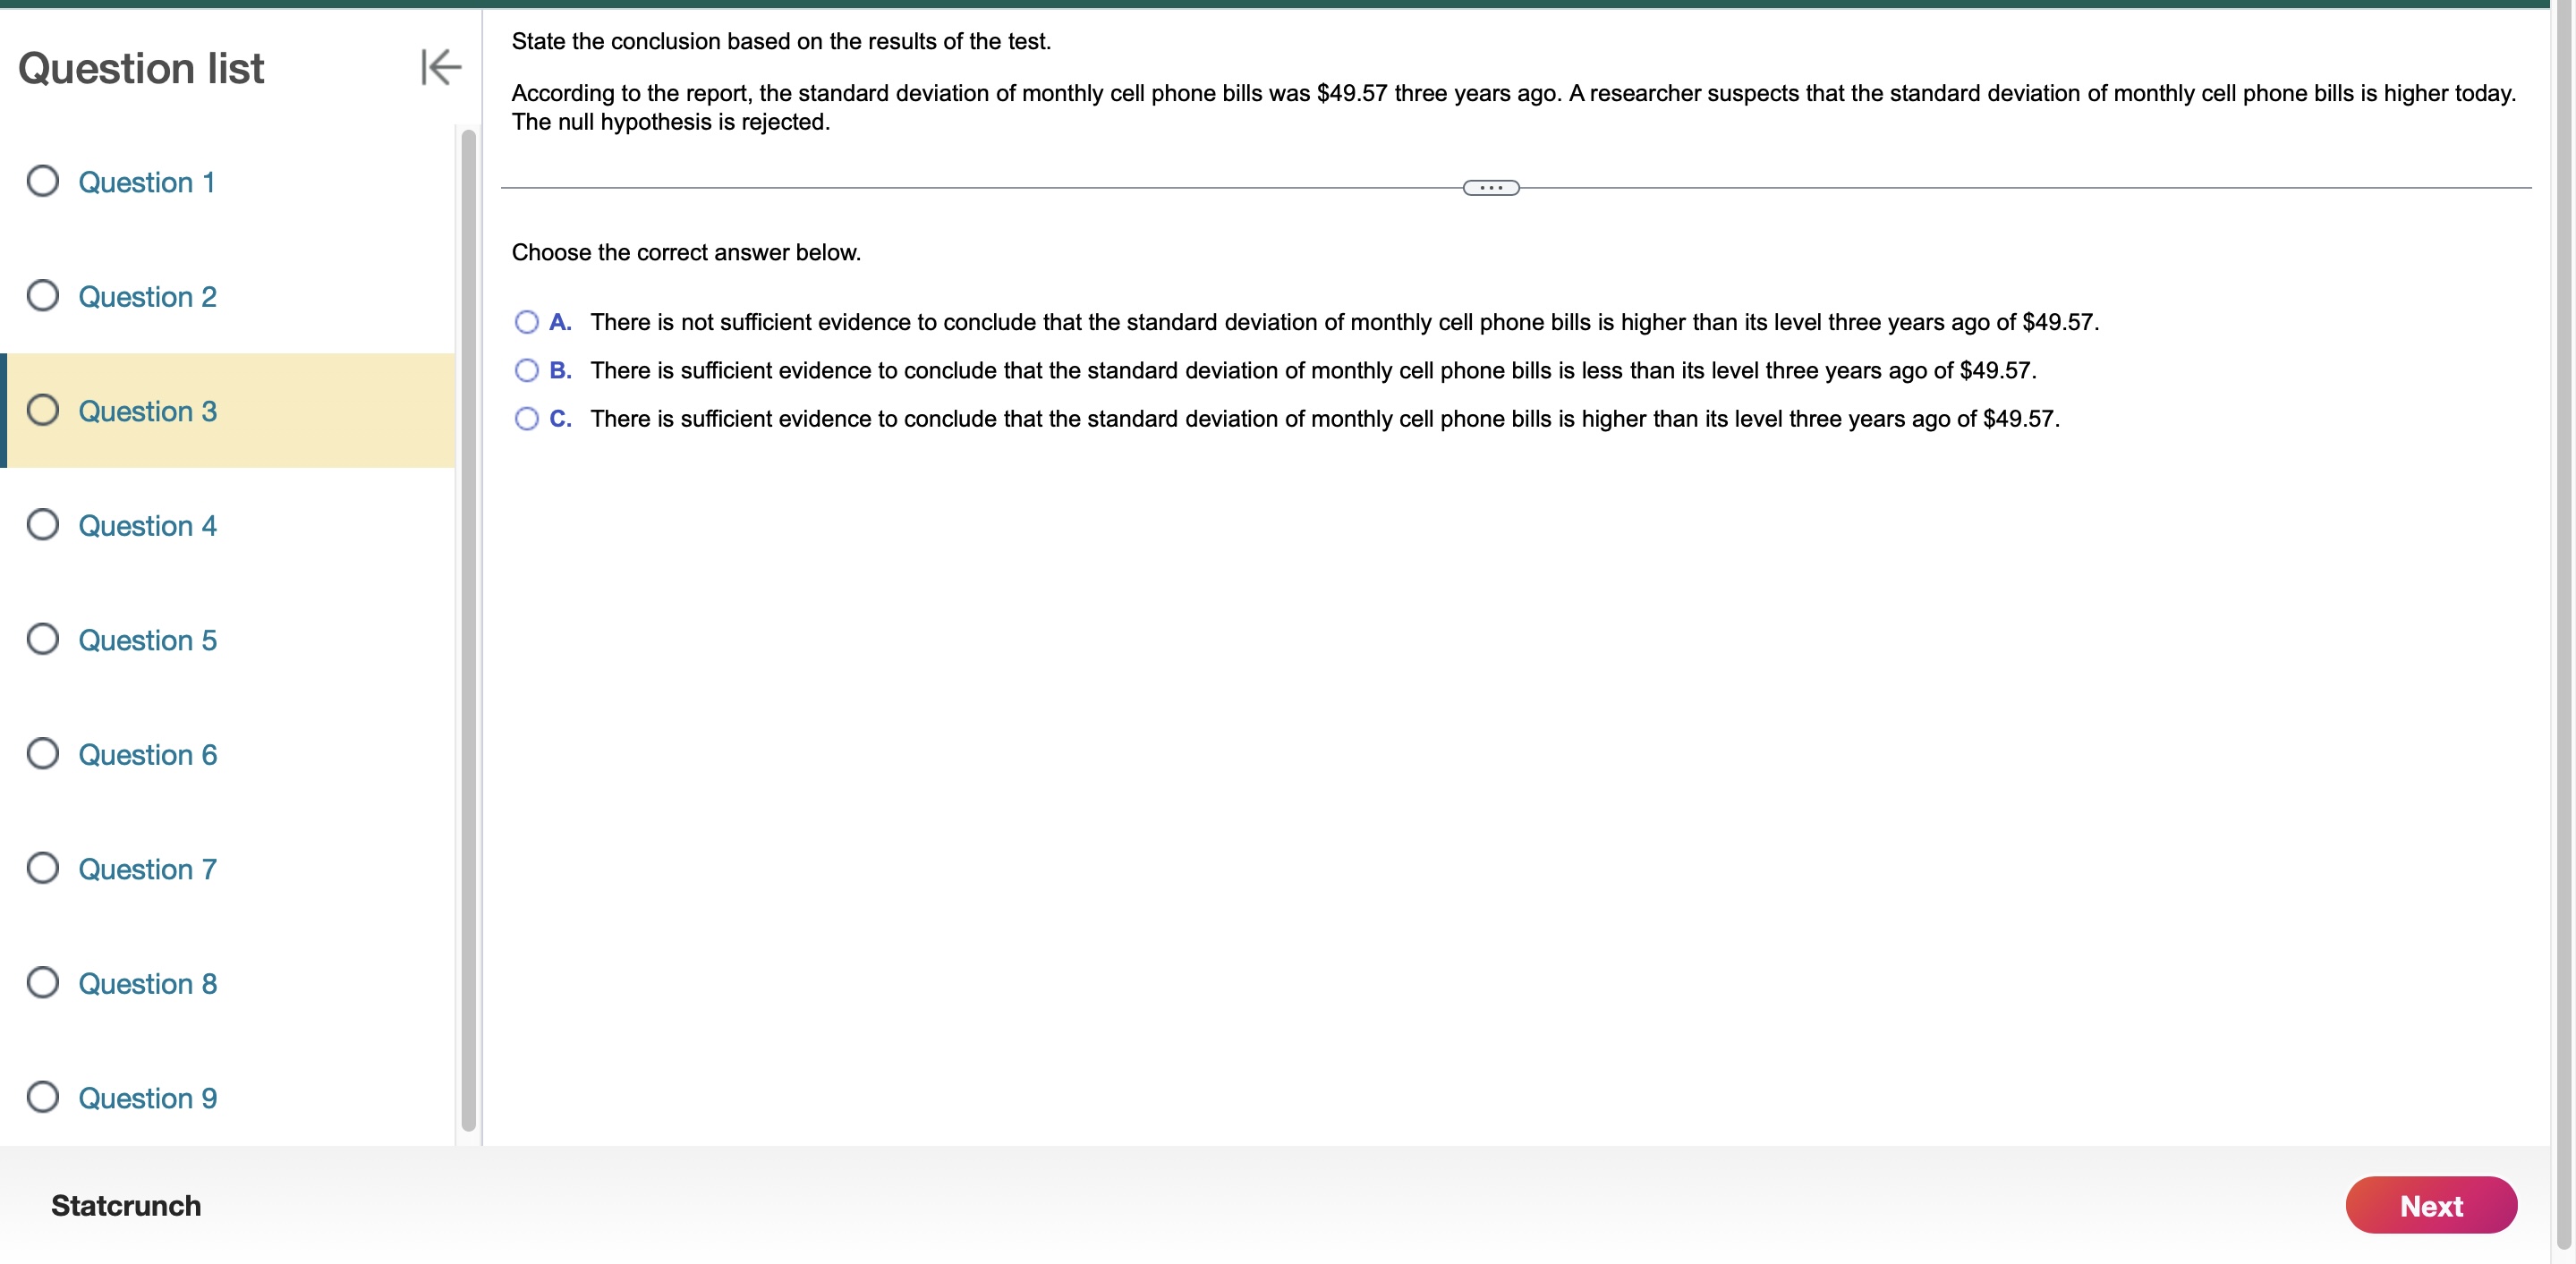
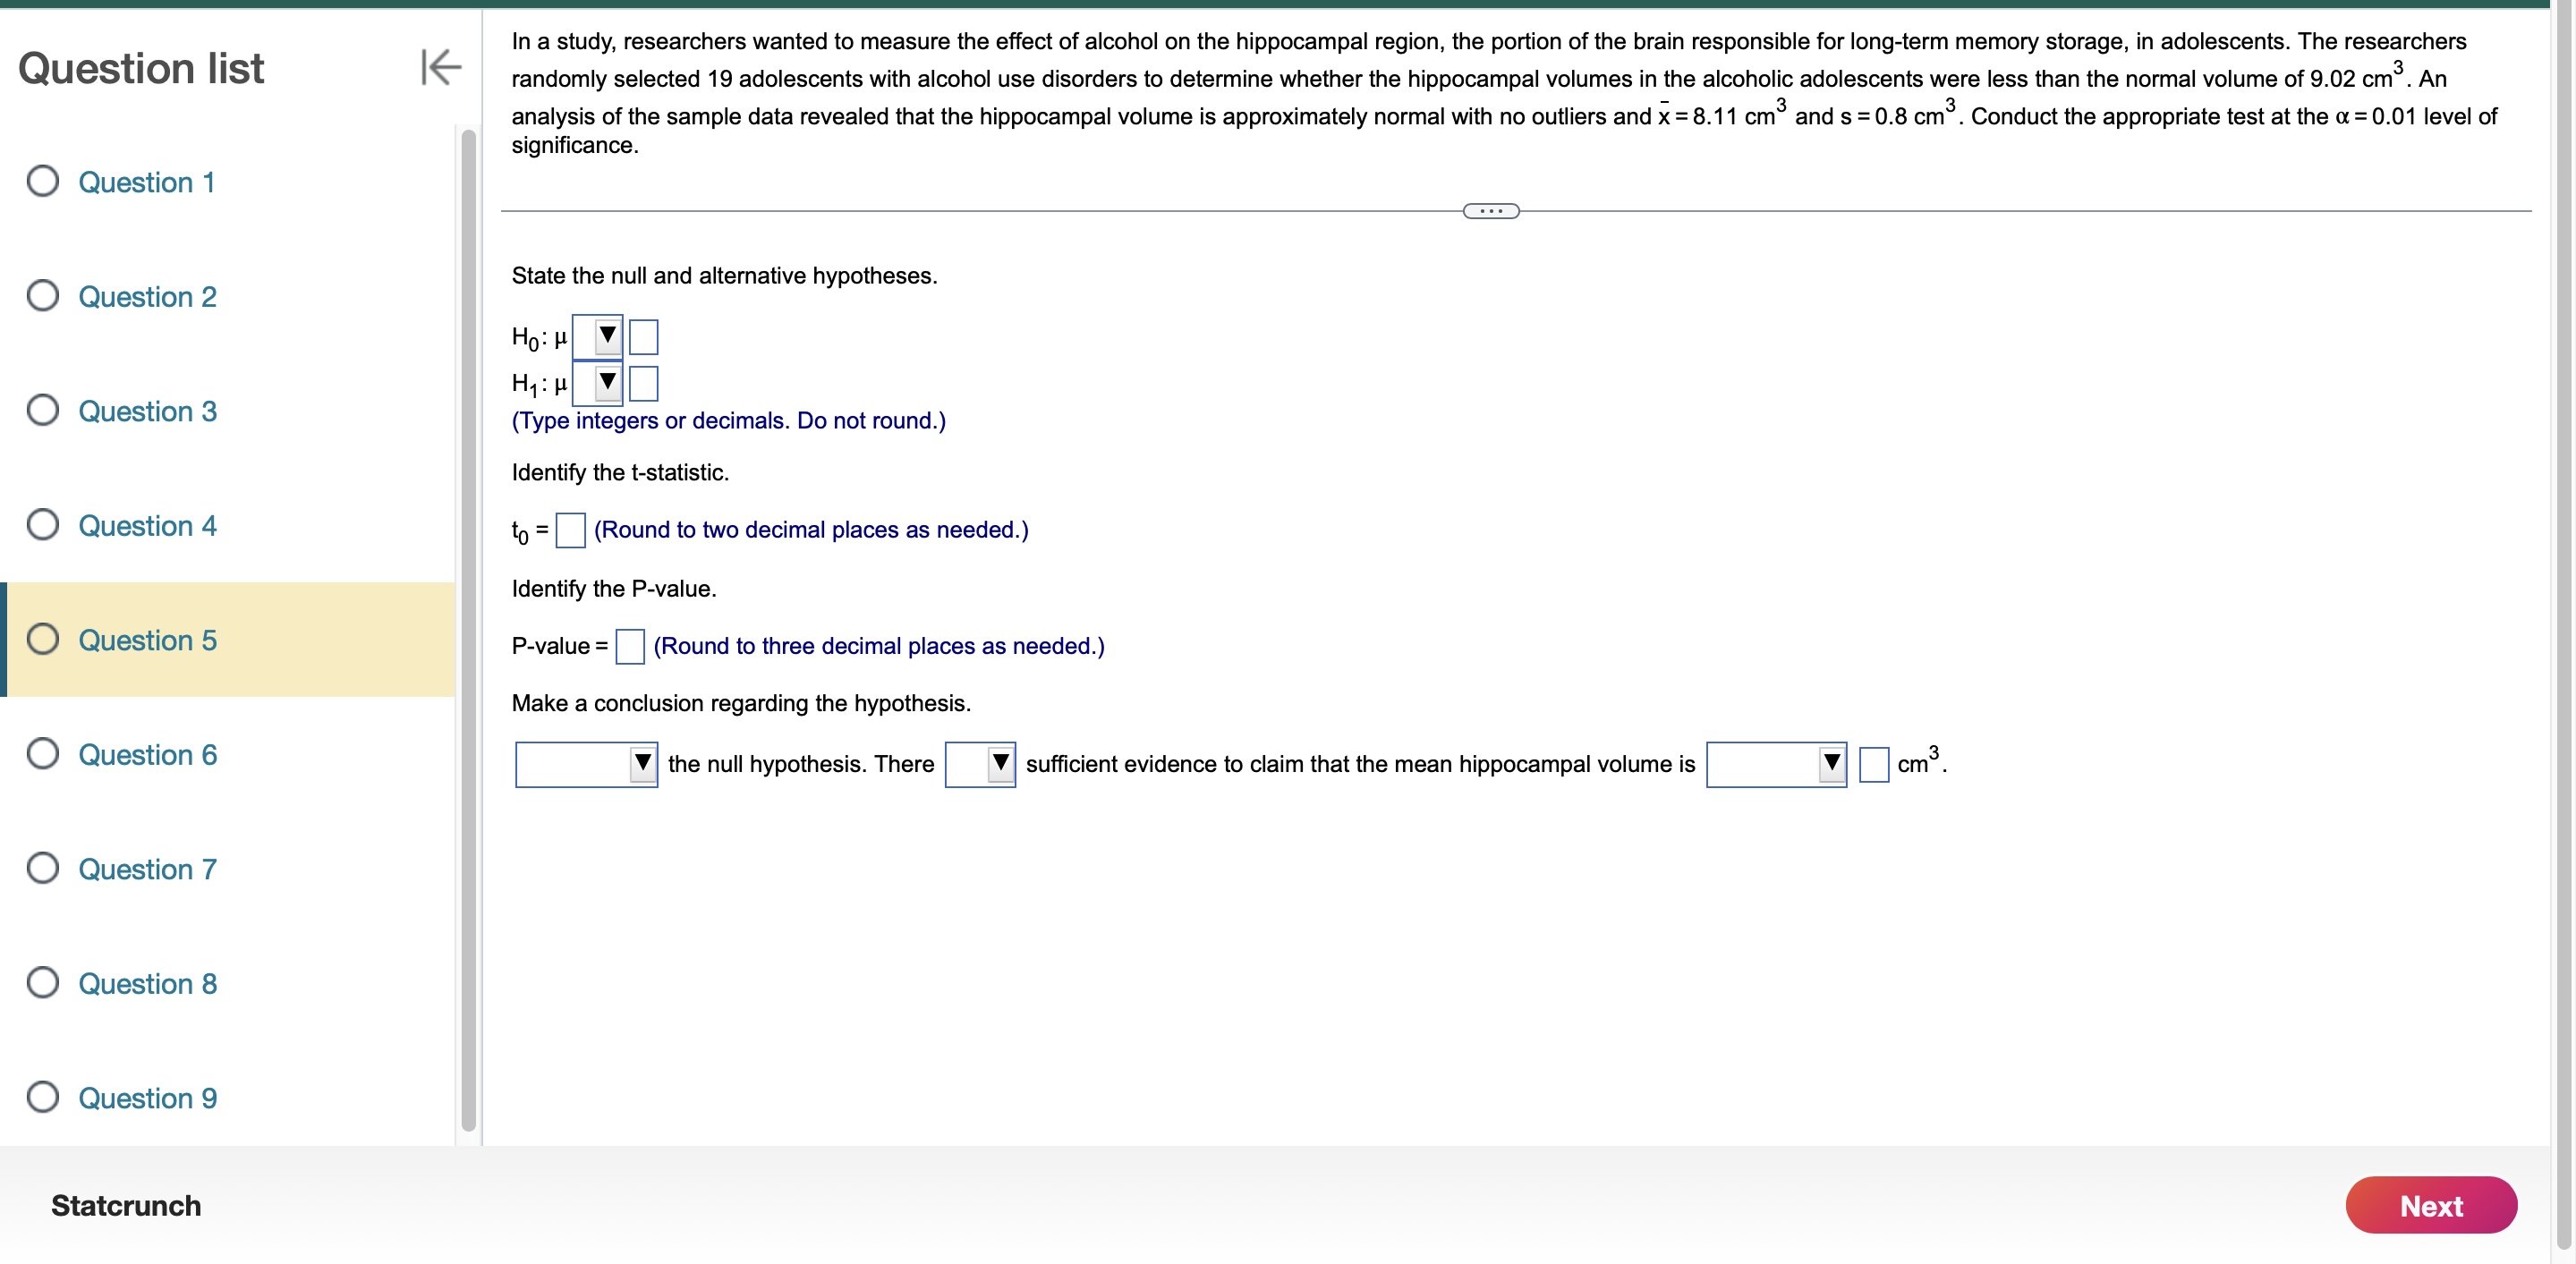
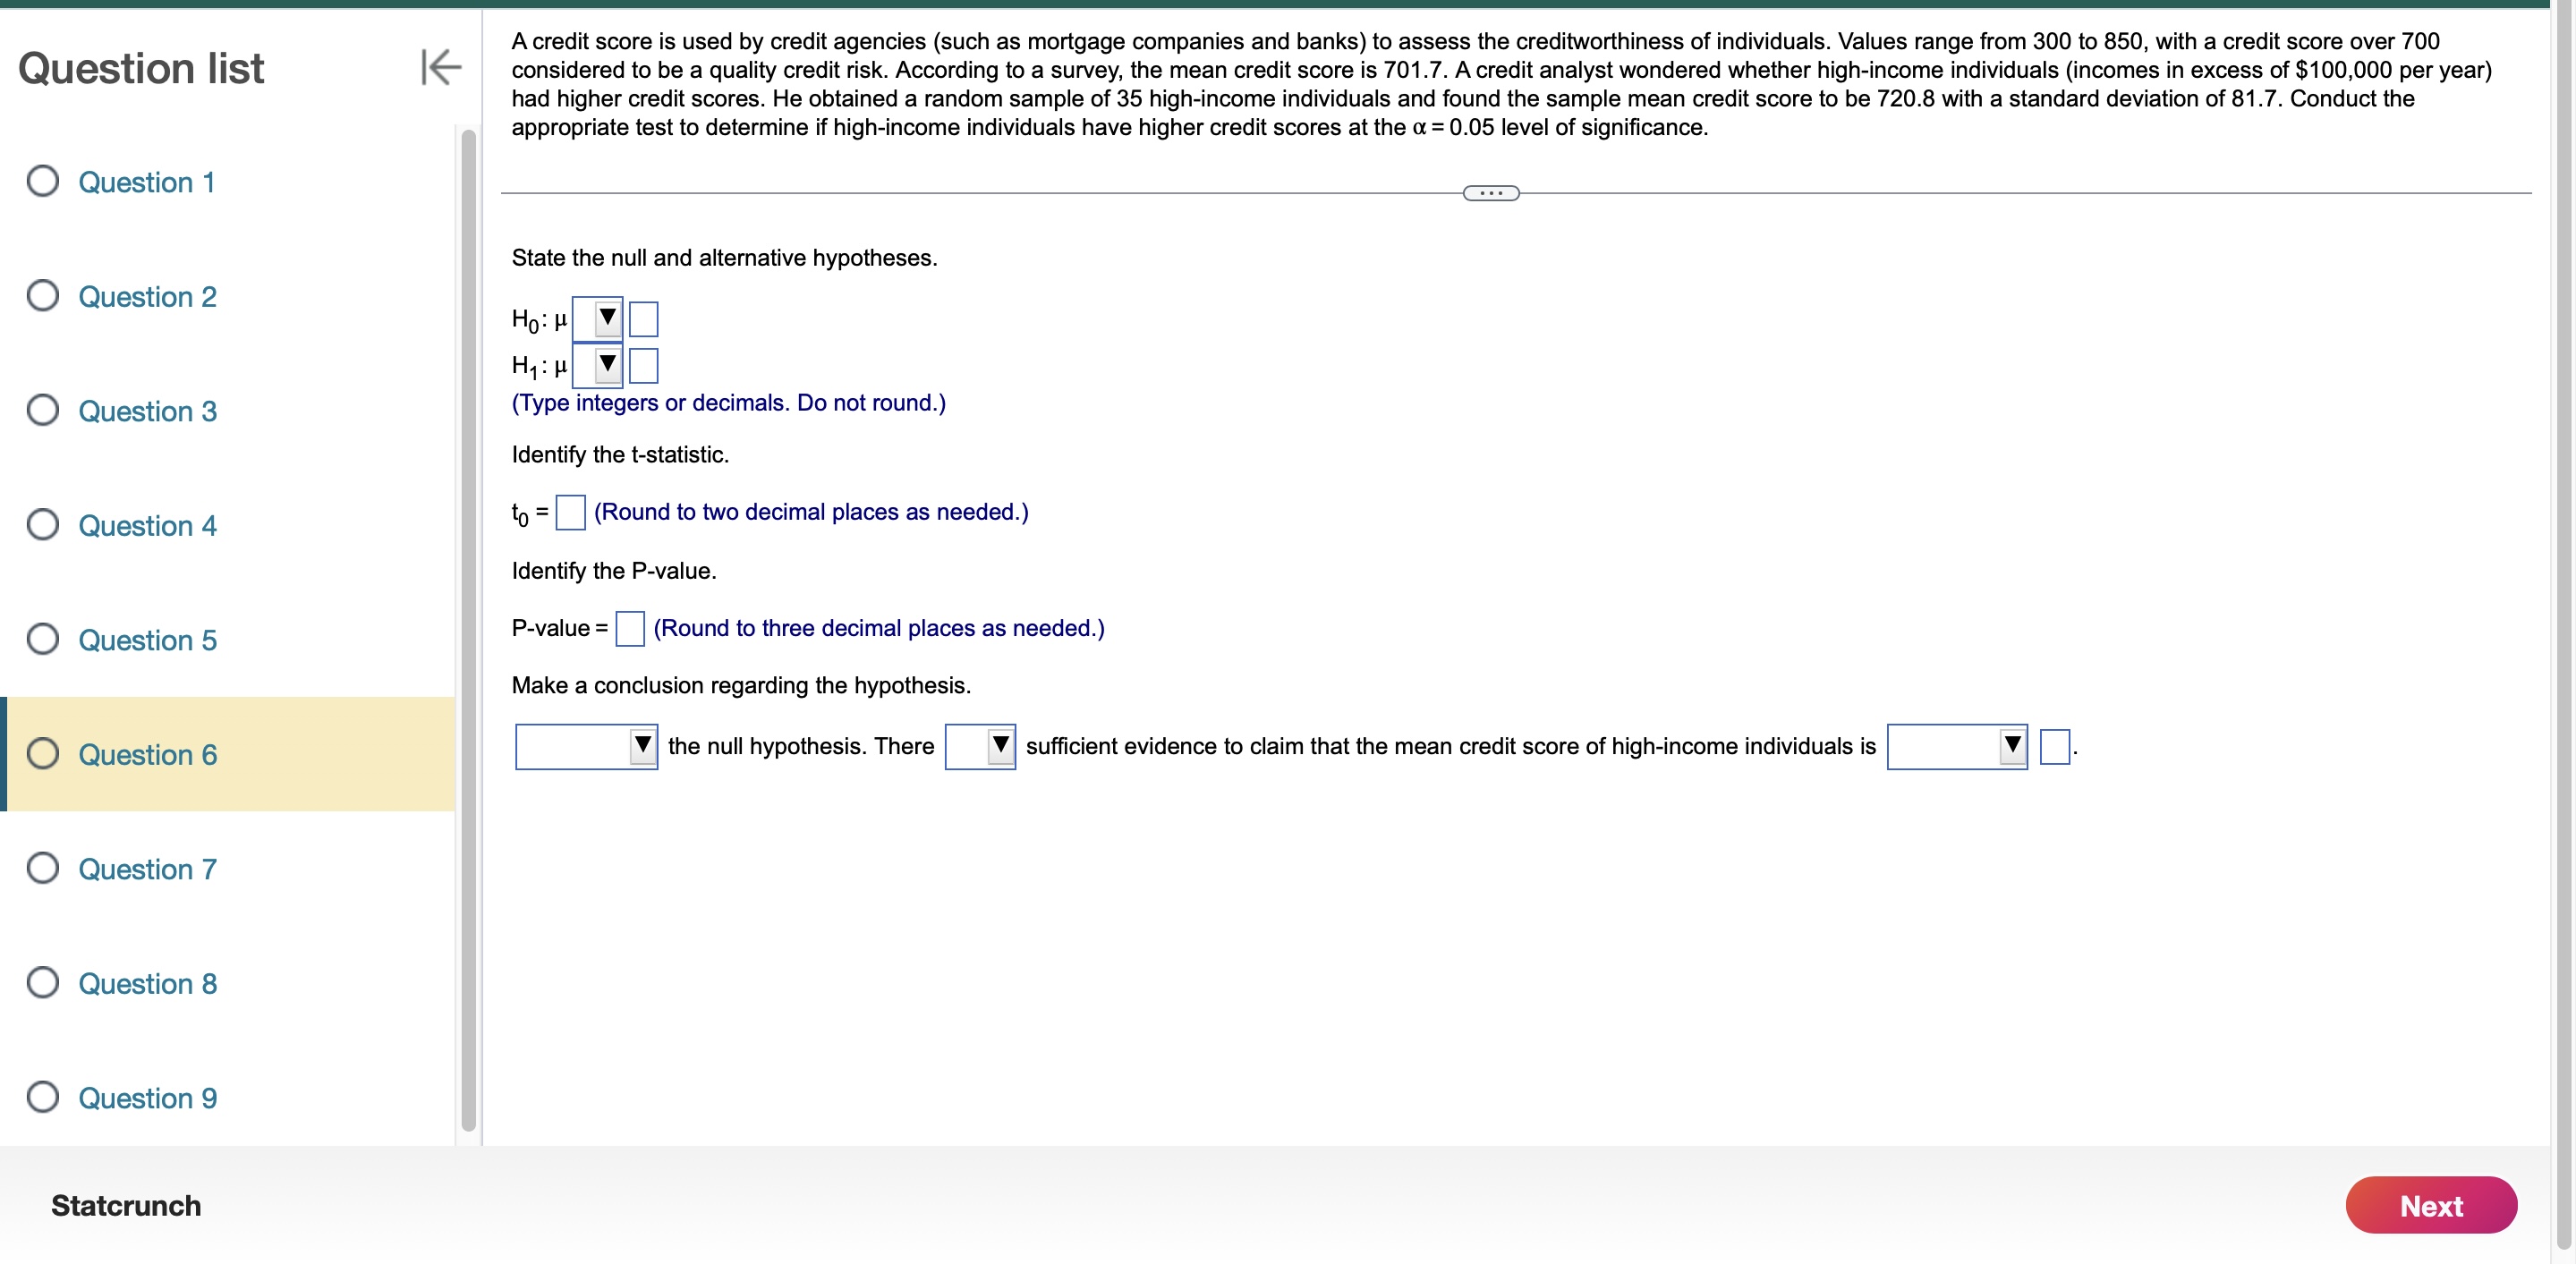
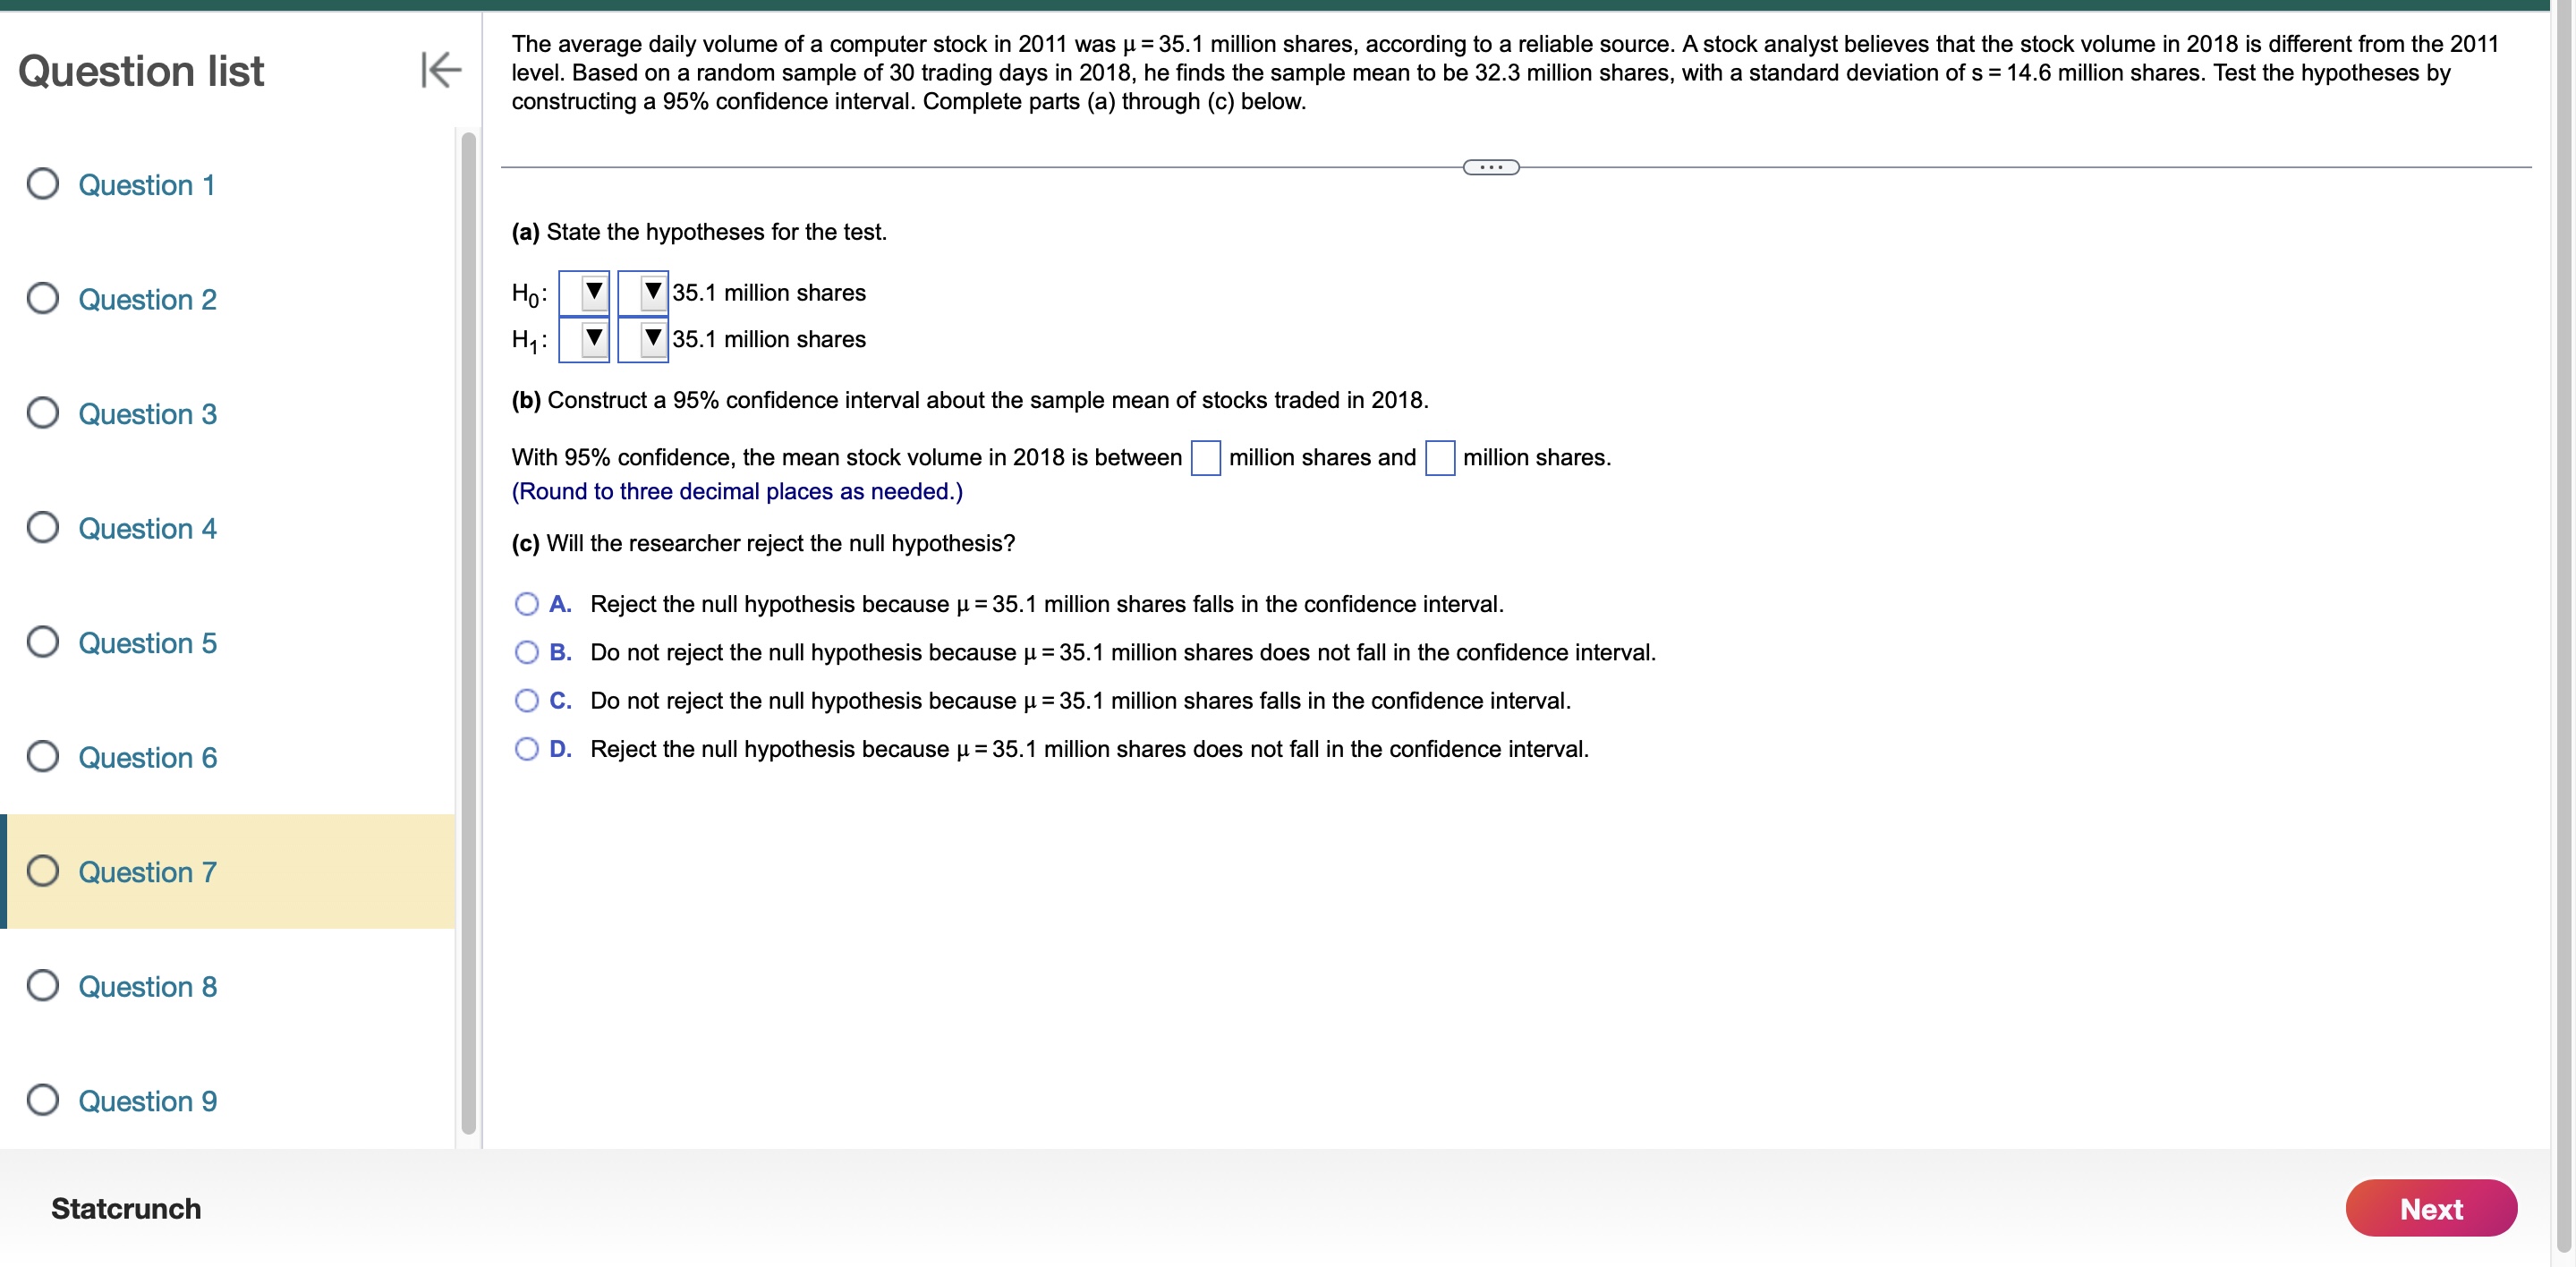
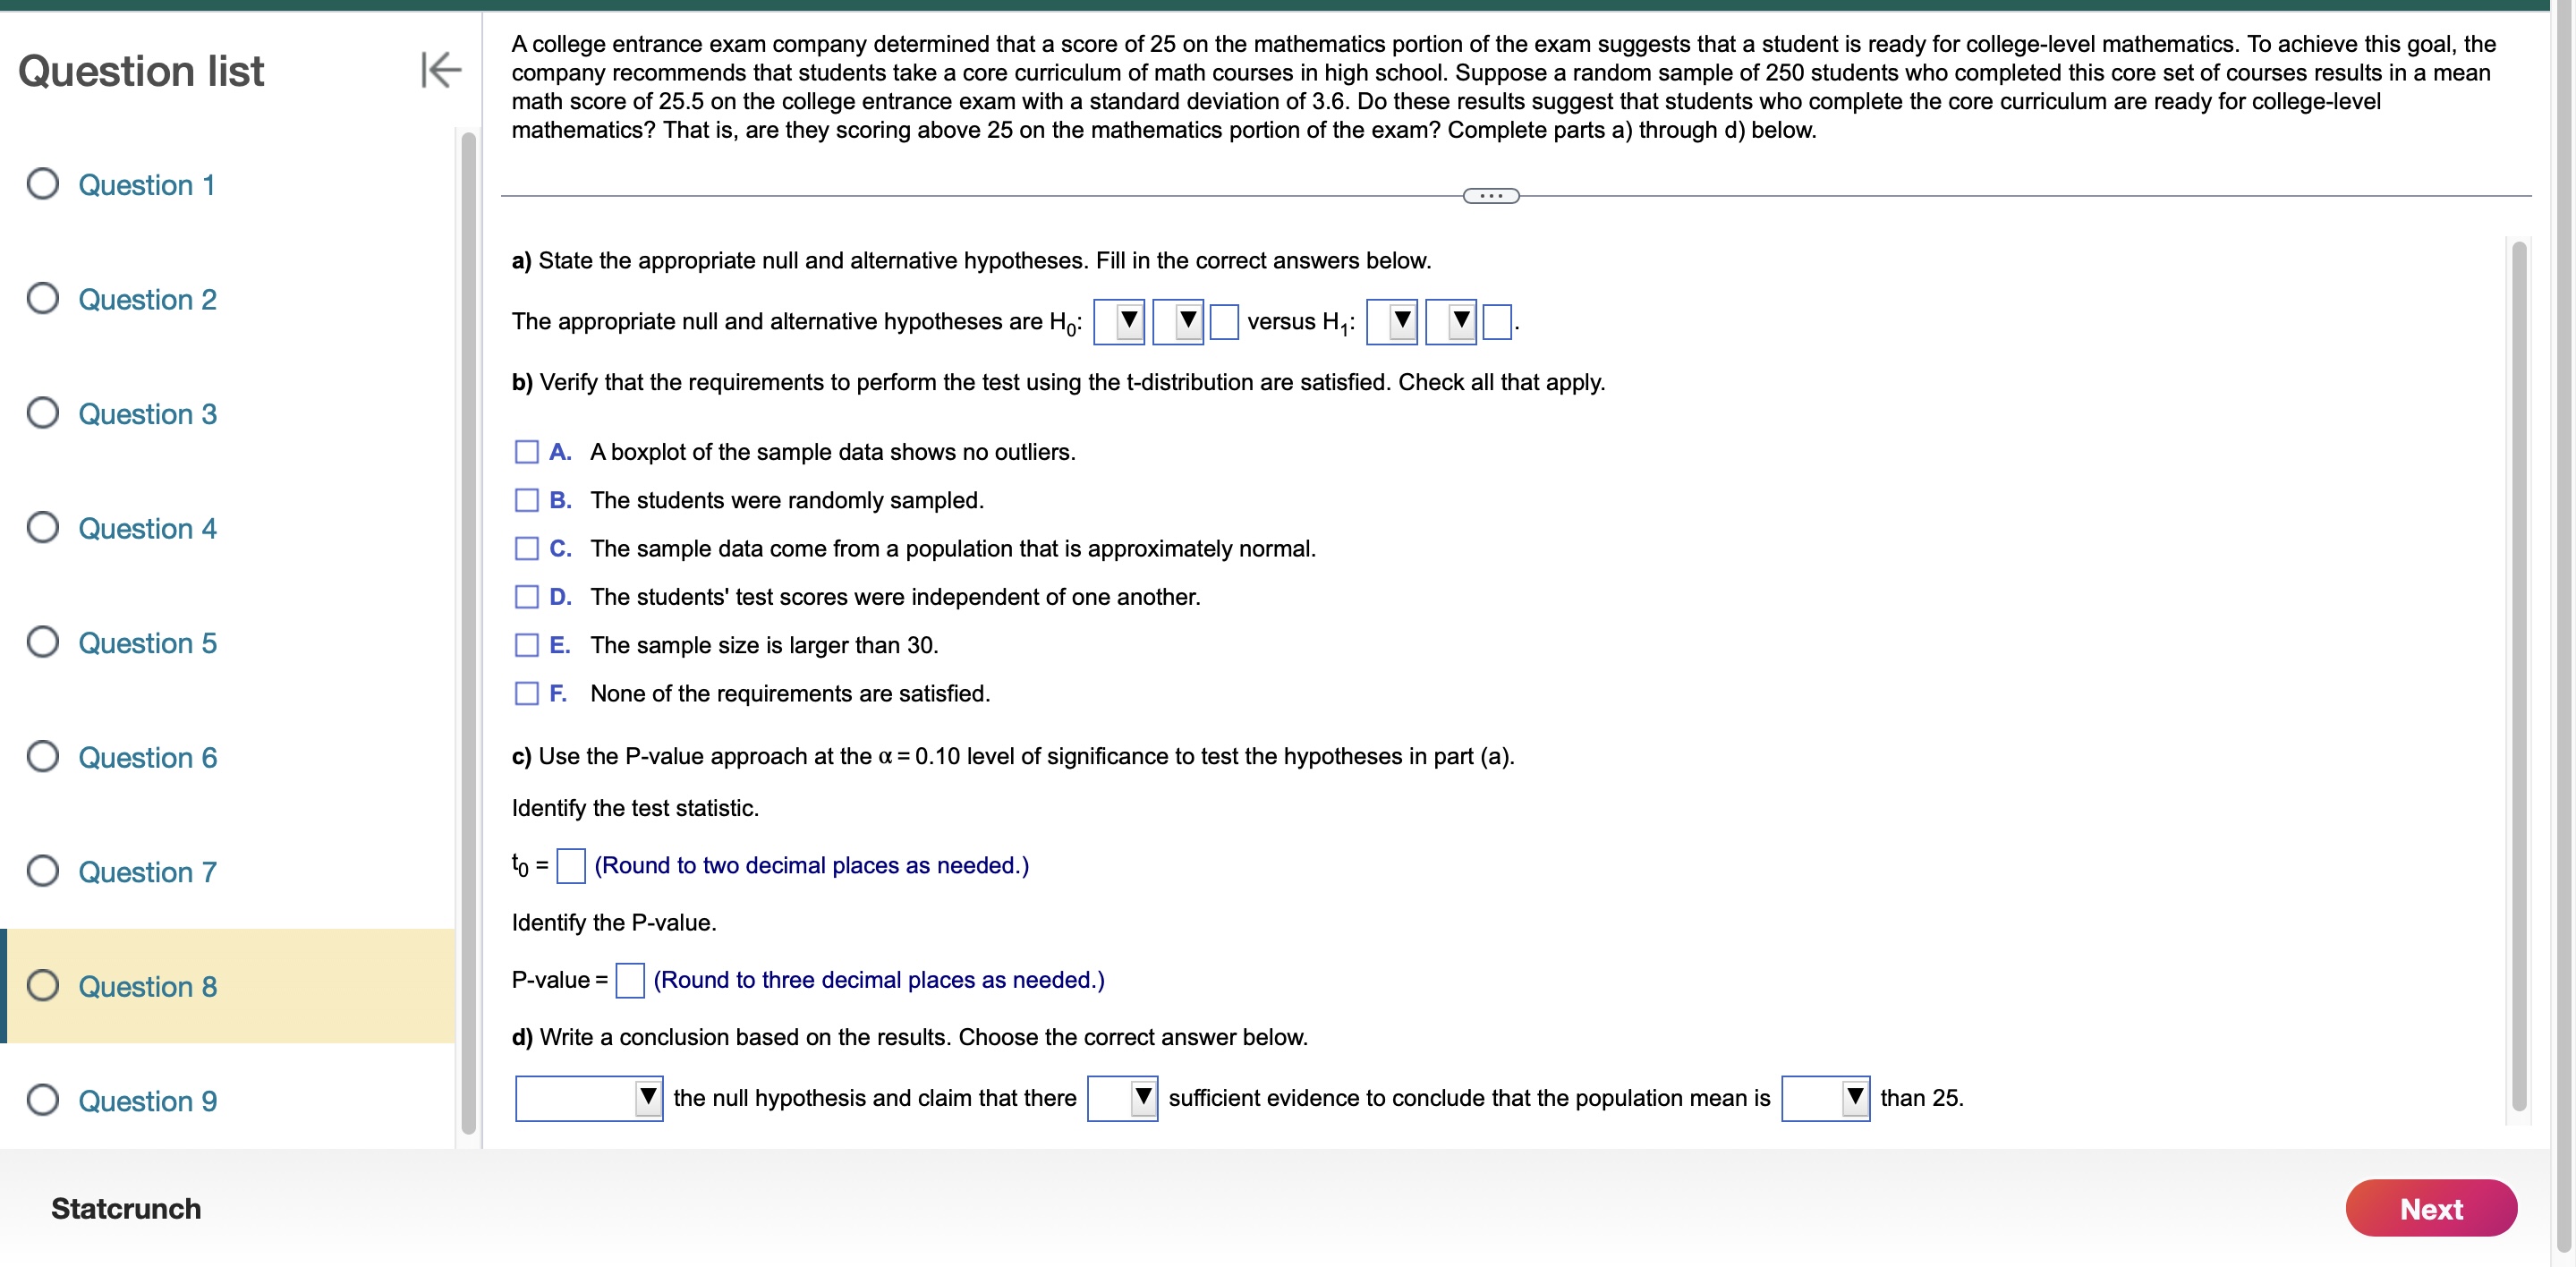
State the conclusion based on the results of the test. Question list K According to the report, the standard deviation of monthly cell phone bills was $49.57 three years ago. A researcher suspects that the standard deviation of monthly cell phone bills is higher today. The null hypothesis is rejected. O Question 1 Choose the correct answer below. O Question 2 O A. There is not sufficient evidence to conclude that the standard deviation of monthly cell phone bills is higher than its level three years ago of $49.57. O B. There is sufficient evidence to conclude that the standard deviation of monthly cell phone bills is less than its level three years ago of $49.57. O Question 3 O C. There is sufficient evidence to conclude that the standard deviation of monthly cell phone bills is higher than its level three years ago of $49.57. O Question 4 Question 5 O Question 6 O Question 7 O Question 8 O Question 9 Statcrunch NextIn a study, researchers wanted to measure the effect at alcohol on the hippocampal region, the portion of the brain responsible for long-term memory storage, in adolescents. The researchers Questlon "St I6 randomly selected 19 adolescents with alcohol use disorders to determine whether the hippocampal volumes in the alcoholic adolescents were less than the normal volume of 9.02 cma. An analysis of the sample data revealed that the hippocampal volume is approximately normal with no outliers and i=8.1'l cm3 and 5 =0.8 cms. Conduct the appropriate test at the u=0.0'l level of signicance. 0 Question 1 . State the null and alternative hypotheses. 0 Question 2 Ho: H V H1 : p V O QUGStlon 3 (Type integers or decimals. Do not round.) Identify the t-statistic. 0 Question 4 '0 = (Round to two decimal places as needed.) Identify the P-value. O QueStion 5 P-value= (Round to three decimal places as needed.) Make a conclusion regarding the hypothesis. 0 QueStion 5 V the null hypothesis. There V sufficient evidence to claim that the mean hippocampal volume is V (me. 0 Question 7 0 Question 8 0 Question 9 . _ A credit score is used by credit agencies (such as mortgage companies and banks) to assess the creditworthiness of individuals. Values range from 300 to 850, with a credit score over 700 Ques'hon "st I6 considered to be a quality credit risk. According to a survey, the mean credit score is 701.7. A credit analyst wondered whether high-income individuals (incomes in excess of $100,000 per year) had higher credit scores. He obtained a random sample of 35 high-income individuals and found the sample mean credit score to be 720.8 with a standard deviation of 81.7. Conduct the appropriate test to determine it high-income individuals have higher credit scores at the or = 0.05 level of signicance. 0 Question 1 State the null and alternative hypotheses. 0 Question 2 Ho: p V H1 : p V 0 Question 3 (Type integers or decimals. Do not round.) Identify the t-statistic. 0 Question 4 ID = (Round to two decimal places as needed.) Identify the P-value. 0 Question 5 P-value= (Round to three decimal places as needed.) Make a conclusion regarding the hypothesis. 0 Question 5 V the null hypothesis. There V sufcient evidence to claim that the mean credit score of high-income individuals is V 0 Question 7 0 Question 8 0 Question 9 The average daily volume of a computer stock in 2011 was u = 35.1 million shares, according to a reliable source. A stock analyst believes that the stock volume in 2018 is different from the 2011 Question list K level. Based on a random sample of 30 trading days in 2018, he finds the sample mean to be 32.3 million shares, with a standard deviation of s = 14.6 million shares. Test the hypotheses by constructing a 95% confidence interval. Complete parts (a) through (c) below. O Question 1 (a) State the hypotheses for the test. O Question 2 Ho 35.1 million shares H1 : 35.1 million shares O Question 3 (b) Construct a 95% confidence interval about the sample mean of stocks traded in 2018. With 95% confidence, the mean stock volume in 2018 is between million shares and million shares. (Round to three decimal places as needed.) O Question 4 (c) Will the researcher reject the null hypothesis? O A. Reject the null hypothesis because u = 35.1 million shares falls in the confidence interval. O Question 5 O B. Do not reject the null hypothesis because u = 35.1 million shares does not fall in the confidence interval. O C. Do not reject the null hypothesis because u = 35.1 million shares falls in the confidence interval. O Question 6 O D. Reject the null hypothesis because u = 35.1 million shares does not fall in the confidence interval. O Question 7 O Question 8 O Question 9 Statcrunch Next. _ A college entrance exam company determined that a score of 25 on the mathematics portion at the exam suggests that a student is ready tor college-level mathematics. To achieve this goal, the Quest|on I|st I6 company recommends that students take a core curriculum of math courses in high school. Suppose a random sample of 250 students who completed this core set ofcourses results in a mean math score of 25.5 on the college entrance exam with a standard deviation of 3.6. Do these results suggest that students who complete the core curriculum are ready for college-level mathematics? That is, are they scoring above 25 on the mathematics portion of the exam? Complete parts a) through d) below. 0 Question 1 a) State the appropriate null and alternative hypotheses. Fill in the correct answers below. 0 QUEStion 2 The appropriate null and alternative hypotheses are H0: V V versus H': V V [1) Verify that the requirements to pertorm the test using the tdistribution are satised. Check all that apply. O Question 3 A. A boxplot of the sample data shows no outliers. . B. The students were randomly sampled. 0 Question 4 C. The sample data come from a population that is approximately normal. 7 D. The students' test scores were independent of one another. 0 Question 5 7 E. The sample size is larger than 30. F. None of the requirements are satised. 0 Question 6 1:) Use the P-value approach at the rt : 0.10 level of signicance to test the hypotheses in part (a). Identify the test statistic. 0 Question 7 In : (Round to two decimal places as needed.) Identify the P-value. 0 Question 8 P-value= (Round to three decimal places as needed.) d) Write a conclusion based on the results. Choose the correct answer below. 0 Question 9 V the null hypothesis and claim that there V sufcient evidence to conclude that the population mean is V than 25
Step by Step Solution
There are 3 Steps involved in it
Step: 1
Get Instant Access to Expert-Tailored Solutions
See step-by-step solutions with expert insights and AI powered tools for academic success
Step: 2
Step: 3
Ace Your Homework with AI
Get the answers you need in no time with our AI-driven, step-by-step assistance