

Answered step by step
Verified Expert Solution
Question
1 Approved Answer
PLEASE PLEASE HELP ME ASAP!!!! Summary information from the financial statements of two companies competing in the same industry follows Barco Kyan Barco Kyani Company
PLEASE PLEASE HELP ME ASAP!!!! 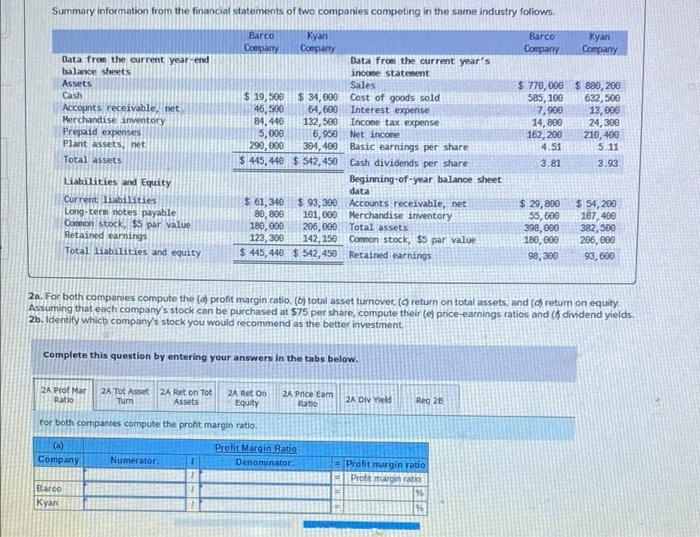
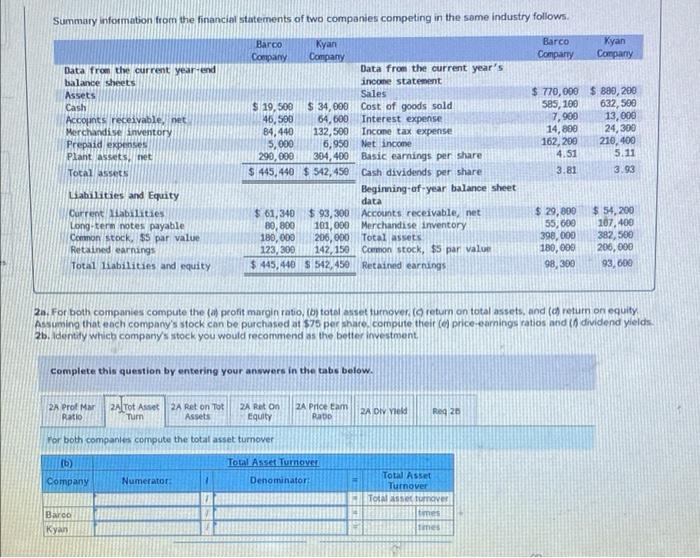
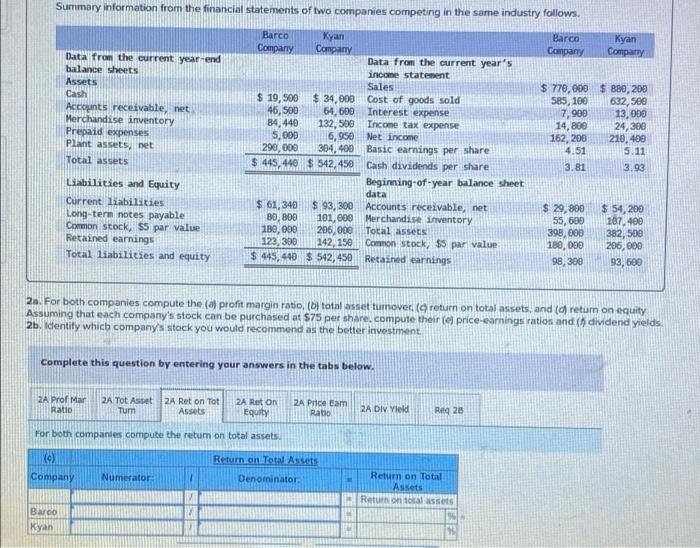
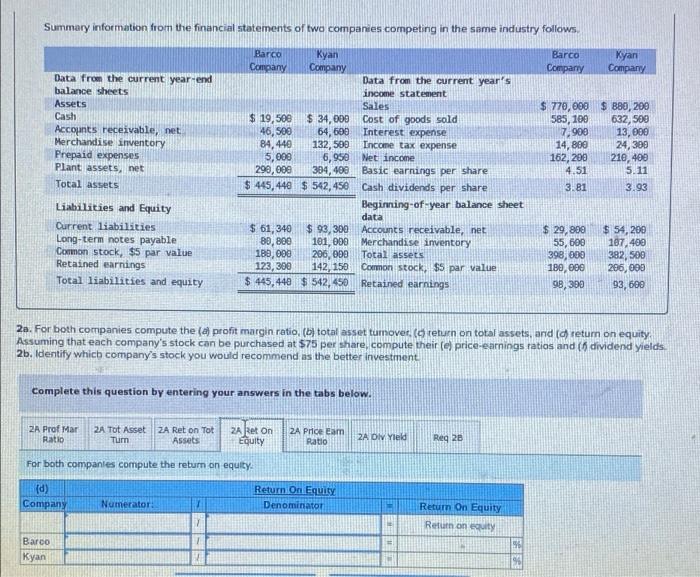
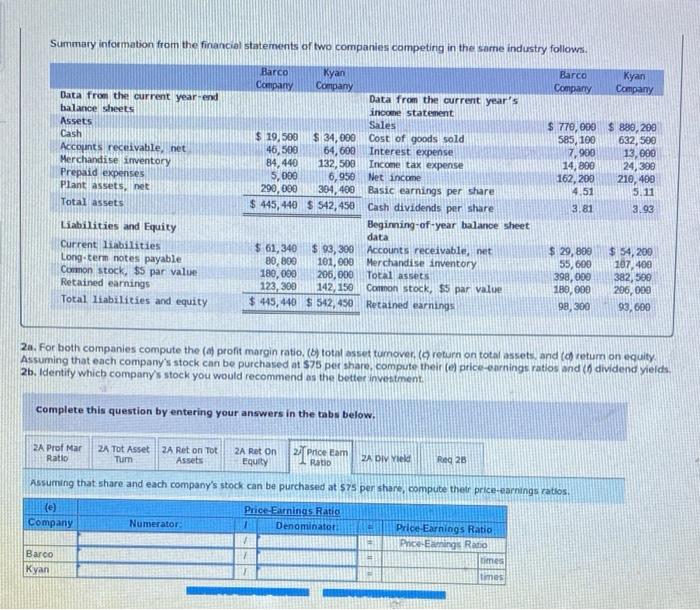
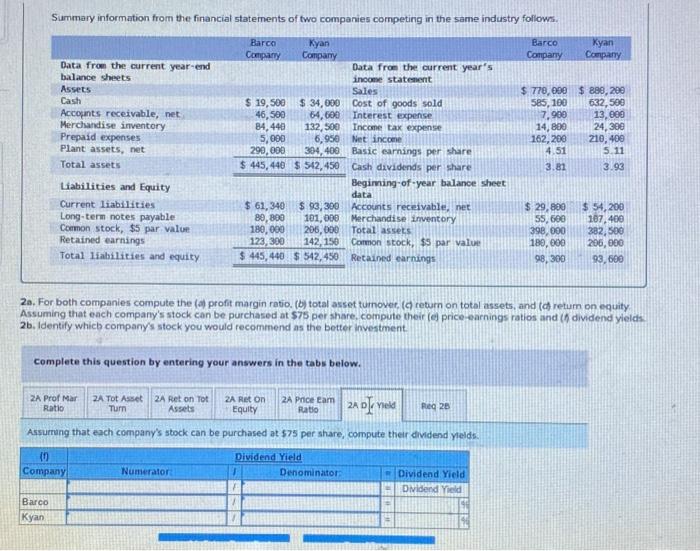
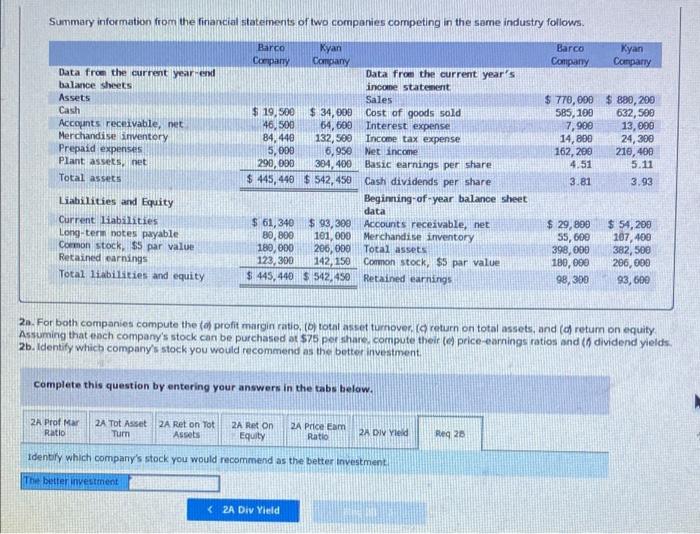
Summary information from the financial statements of two companies competing in the same industry follows Barco Kyan Barco Kyani Company Company Company Company Data from the current year-end Data from the current year's balance sheets income statement Assets Sales $ 770,000 $ 890,200 Cash $ 19,500 $ 34,000 Cost of goods sold 585, 100 632,500 Accounts receivable, net 46,500 54,600 Interest expense 7.900 13,000 Merchandise inventory 84.440 132,500 Income tax expense 14,800 24,300 Prepaid expenses 5,099 6,950 Net income 162,200 210,400 Plant assets, net 290,000 304,400 Basic earnings per share 4.51 5.11 Total assets $ 445,440 $ 542,450 Cash dividends per share 3.81 3.93 Liabilities and Equity Beginning-of-year balance sheet Current liabilities $ 61,340 $ 93,300 Accounts receivable, net $ 29,800 $ 54,200 Long-term notes payable 86,800 101,000 Merchandise inventory 55,600 187,400 Connon stock, $5 par value 180,000 206,000 Total assets 398,000 382,500 Retained earnings 123, 300 142, 150 Common stock, $5 par value 180,000 286,000 Total liabilities and equity $ 445,440 $ 542,450 Retained earnings 98,300 93,600 data 2a. For both companies compute the (a) profit margin ratio. (b) total asset turnover (return on total assets, and (dreturn on equity Assuming that each company's stock can be purchased at $75 per share, compute their (e) price-earnings ratios and h dividend yields. 2b. Identity which company's stock you would recommend as the better investment Complete this question by entering your answers in the tabs below. 2A Prof Mar Ratio 2A Tot Asset 2A Reton Tot Tum Assets 2A Ret On Equity 24 Price Cam Ratio 2A DIV Yield Reg 20 for both companies compute the proht margin ratio. () Company Numerator: Protit Margin Ratio Denominator Profit margin ratio Protargin ratio 96 Barco Summary information from the financial statements of two companies competing in the same industry follows Barco Company Kyan Company Data from the current year-end balance sheets Assets Cash Accounts receivable, net Merchandise inventory Prepaid expenses Plant assets. net Total assets 7,900 Barco Kyan Company Company Data from the current year's income statement Sales $ 19,500 $ 34,000 Cost of goods sold 46,500 64,600 Interest expense 84,440 132,500 Income tax expense 5,000 6,950 Net income 290,000 304,400 Basic earnings per share $ 445,440 $ 542,450 Cash dividends per share Beginning of year balance sheet data $ 61,340 $ 93,300 Accounts receivable, net 80, 800 101,000 Merchandise inventory 180,000 206,000 Total assets 123, 300 142, 150 Common stock, $ par value $ 445,440 $ 542, 450 Retained earnings $ 770,000 $ 890,200 585, 100 632,500 13,000 14,800 24,300 162,200 210,400 4.51 5.11 3.81 3.93 Liabilities and Equity Current liabilities Long ter notes payable Common stock, SS par value Retained earnings Total liabilities and equity $ 29,800 55,000 390,000 180,000 98,300 $ 54,200 107, 400 382,500 200,000 93,000 20. For both companies compute the profit margin ratio, (b) total asset turnover (return on total assets, and (c) return on equity Assuming that each company's stock can be purchased at 575 per share, compute thelt (price-earnings ratios and to dividend yields 26. Identity which company's stock you would recommend as the better investment Complete this question by entering your answers in the tabs below. 2A Prof Mar Ratio 2A Tot Asset 2A Reton Tot Turn Assets 2A Reton Equity 2A Price tam Rabo 2A DIV Yield Reg 28 For both companies compute the total asset turnover (6) Total Asset Turnover Denominator Company Numerator: Total Asset Turnover Totaltumver times ties Barco Kyan Summary information from the financial statements of two companies competing in the same industry follows. Barco Company Kyan Company Data from the current year-end balance sheets Assets Cash Accounts receivable, net Merchandise inventory Prepaid expenses Plant assets, et Total assets Barco Kyan Company Company Data from the current year's income statement Sales $ 19,500 $ 34,000 Cost of goods sold 46,500 64,500 Interest expense 84,440 132,500 Income tax expense 5,000 6,95 Net income 290,000 304,400 Basic earnings per share $ 445,440 $ 542,450 Cash dividends per share Beginning-of-year balance sheet data $ 61,340 $ 93, 300 Accounts receivable, net 80, 800 101,000 Merchandise inventory 180,000 206, 000 Total assets 123,300 142, 150 Common stock$ par value $ 445,440 $ 542, 450 Retained earnings $ 770,000 $ 880, 200 585,100 632, see 7,900 13,000 14,800 24,300 162,200 210,400 4.51 5.11 3.81 3.93 Liabilities and Equity Current liabilities Long-ter notes payable Common stock, SS par value Retained earnings Total liabilities and equity $ 29,800 55,600 398,000 189,000 98,300 $ 54,200 107 400 382,500 206,000 93,500 20. For both companies compute the (aprofit margin ratio, (o total asset tumover, (return on total assets, and return on equity Assuming that each company's stock can be purchased at $75 per share, compute their le price-earnings ratios and.( dividend yields 2b. Identify which company's stock you would recommend as the better investment Complete this question by entering your answers in the tabs below. ZA Prof Mar Ratio 24 TotAsset 2A Ret on Tot Tum Assets 2A Ret On Equity ZA Price Eam Ratio 2A DIV Yield Reg 28 For both companies compute the retum on total assets Return on Total Assets Company Numerator Denominator Retum on Total Assets Return toalet Barco kyan Summary information from the financial statements of two companies competing in the same industry follows Barco Company Kyan Company Data from the current year-end balance sheets Assets Cash Accounts receivable, net Merchandise inventory Prepaid expenses Plant assets, net Total assets Barco Kyan Company Company Data from the current year's income statement Sales $ 19,50 $ 34,000 Cost of goods sold 46,500 64,500 Interest expense 84,440 132,500 Income tax expense 5,00 Net income 290,000 304,400 Basic earnings per share $ 445,440 $ 542,450 Cash dividends per share Beginning-of-year balance sheet data $ 61,340 $ 93,300 Accounts receivable, net 80.800 181,000 Merchandise inventory 180,000 206,000 Total assets 123, 300 142, 150 Common stock, $5 par value $ 445,440 $ 542, 450 Retained earnings $ 770,000 $ 880, 200 585, 100 632,500 7.900 13,000 14,800 24,300 162,200 210, 400 4.51 5.11 3.81 3.93 6,95 Liabilities and Equity Current liabilities Long-term notes payable Common stock, $5 par value Retained earnings Total liabilities and equity $ 29,800 55,600 398,000 180,000 98,390 $ 54,200 107,400 382,500 286,000 93,600 2a. For both companies compute the (a) profit margin ratio, (b) total asset tumover, (return on total assets, and to return on equity Assuming that each company's stock can be purchased at $75 per share, compute their(e) price-earnings ratios and (6 dividend yields 2b. Identity which company's stock you would recommend as the better investment Complete this question by entering your answers in the tabs below. ZA Prof Mar Ratio 2A Tot Asset 2A Ret on Tot Turn Assets ZA Ret on Equity 2A Price Eam Ratio ZA DIV Yield Reg 26 For both companies compute the return on equity d) Company Return On Equity Denominator Numerator: Return On Equity Return on equity Barco Kyan Summary information from the financial statements of two companies competing in the same industry follows. Barco Company Kyan Company Data from the current year-end balance sheets Assets Cash Accounts receivable, net Merchandise inventory Prepaid expenses Plant assets, bet Total assets Barco Kyan Company Company Data from the current year's income statement Sales $ 19,500 $ 34,000 Cost of goods sold 46,500 64,600 Interest expense 84,440 132,500 Income tax expense 5,000 6,95 Net income 290,000 304, 409 Basic earnings per share $ 445,440 S 542, 450 Cash dividends per share Beginning-of-year balance sheet data $ 61,340 $ 93,300 Accounts receivable, net 80.800 101,000 Merchandise inventory 180,000 205,000 Total assets 123, 300 142, 150 Common stock, $$ par value $ 445,440 $ 542, 450 Retained earnings $ 770,000 $ 880,290 585, 100 632,500 7.900 13,000 14,800 24,300 162,200 210,400 4.51 5.11 3.81 3.93 Liabilities and Equity Current liabilities Long term notes payable Common stock, $ par value Retained earnings Total liabilities and equity $ 29,800 55,600 398,000 180,000 98,300 $ 54,200 107,400 382,500 206,000 93,000 2a. For both companies compute the (aprofit margin ratio (6) total asset turnover (return on total assets, and return on equity Assuming that each company's stock can be purchased at $75 per share, compute their (el price-earnings ratios and dividend yields 2b. Identity which company's stock you would recommend as the better investment. Complete this question by entering your answers in the tabs below. 2A Prof Mar Ratio ZA Tot Asset I ZA Reton Tot Tum Assets 24 Reton price tam Equity Ratio ZA DIV Yield Reg 28 Assuming that share and each company's stock can be purchased at 575 per share, compute their price-earnings ratios. (e) Company Numerator: Price Earnings Ratio Denominatori Price Earnings Ratio Price-Earnings Ratio mes Barco Kyan times Summary information from the financial statements of two companies competing in the same industry follows. Kyan Barco Company Kyan Company Data from the current year-end balance sheets Assets Cash Accounts receivable, net Merchandise inventory Prepaid expenses Plant assets, net Total assets Liabilities and Equity Current liabilities Long-term notes payable Cormon stock, $5 par value Retained earnings Total liabilities and equity Barco Company Company Data from the current year's income statement Sales $ 19,500 $ 34,000 Cost of goods sold 46,500 64,600 Interest expense B4, 440 132,500 Income tax expense 5,000 6,950 Net income 290,000 304,400 Basic earnings per share $ 445, 440 $ 542,450 Cash dividends per share Begiming-of-year balance sheet data $ 61,340 $ 93,300 Accounts receivable, net 89,800 101,000 Merchandise inventory 180,000 206,000 Total assets 123,300 142, 150 Common stock, $ par value $ 445,440 $ 542,450 Retained earnings $ 778,090 $ 888, 200 585, 100 632,500 7.900 13,000 14,800 24,388 162,200 210, 400 4.51 5.11 3.81 3.93 $ 29,800 55,600 398,000 180,000 98,300 $ 54,200 187,400 382,500 206,000 93.600 20. For both companies compute the (a) profit margin ratio. (b) total asset turnover. ( return on total assets, and to return on equity Assuming that each company's stock can be purchased at $75 per share, computo their price earnings ratios and (y dividend yields 2b. Identify which company's stock you would recommend as the better investment Complete this question by entering your answers in the tabs below. ZA Prof Mar ZA Tot Asset 2A Ret on Tot 2A Riet on 2A Price Eam Ratio Turn Assets Equity Ratio 21 ole viele Reg 28 Assuming that each company's stock can be purchased at 575 per share, compute their dividend yields. 0 Dividend Yield Company Numerator Denominator Dividend Yield Didend Yield Barco Kyan Summary information from the financial statements of two companies competing in the same industry follows. Kyan Barco Company Kyan Company Data from the current year-end balance sheets Assets Cash Accounts receivable, net Merchandise inventory Prepaid expenses Plant assets, net Total assets Barco Company Company Data from the current year's income statement Sales $ 19,500 $ 34,000 Cost of goods sold 46,500 64,600 Interest expense 84,440 132,500 Income tax expense 5,000 6,95 Net income 290,000 304,400 Basic earnings per share $ 445,440 $542, 450 Cash dividends per share Beginning-of-year balance sheet data $ 61,340 $ 93,399 Accounts receivable, net 80,000 101,000 Merchandise inventory 180,000 206, 000 Total assets 123,300 142, 150 Common stock. $5 par value $ 445, 440 $ 542,450 Retained earnings $ 770,000 $ 880,200 585, 100 632,500 7,900 13,000 14,800 24,300 162,200 210, 400 4.51 5.11 3.81 3.93 Liabilities and Equity Current liabilities Long-term notes payable Common stock, SS par value Retained earnings Total liabilities and equity $ 29,800 55,600 398,000 180,000 98,300 $ 54,200 107, 100 382,500 206,000 93,600 2. For both companies compute the profit margin ratio, (o total asset turnover. ( return on total assets, and to return on equity Assuming that each company's stock can be purchased at $75 per share, compute their price earnings ratios and dividend yields 2b. Identity which company's stock you would recommend as the better investment complete this question by entering your answers in the tabs below. 2A Prof Mar Ratio 2A Tot Asset 2A Reton Tot Tum Assets 2A Ret on Equity ZA Price Eam Ratio 2A DIV Yield Reg 26 Identify which company's stock you would recommend as the better Investment. The better investment 2A Div Yield Step by Step Solution
There are 3 Steps involved in it
Step: 1

Get Instant Access to Expert-Tailored Solutions
See step-by-step solutions with expert insights and AI powered tools for academic success
Step: 2

Step: 3
Ace Your Homework with AI
Get the answers you need in no time with our AI-driven, step-by-step assistance
Get Started
Advances In Accounting Volume 23
Authors: Philip M J Reckers
1st Edition
0762314257, 9780762314256