 Please please help with these questions and the steps. thank you
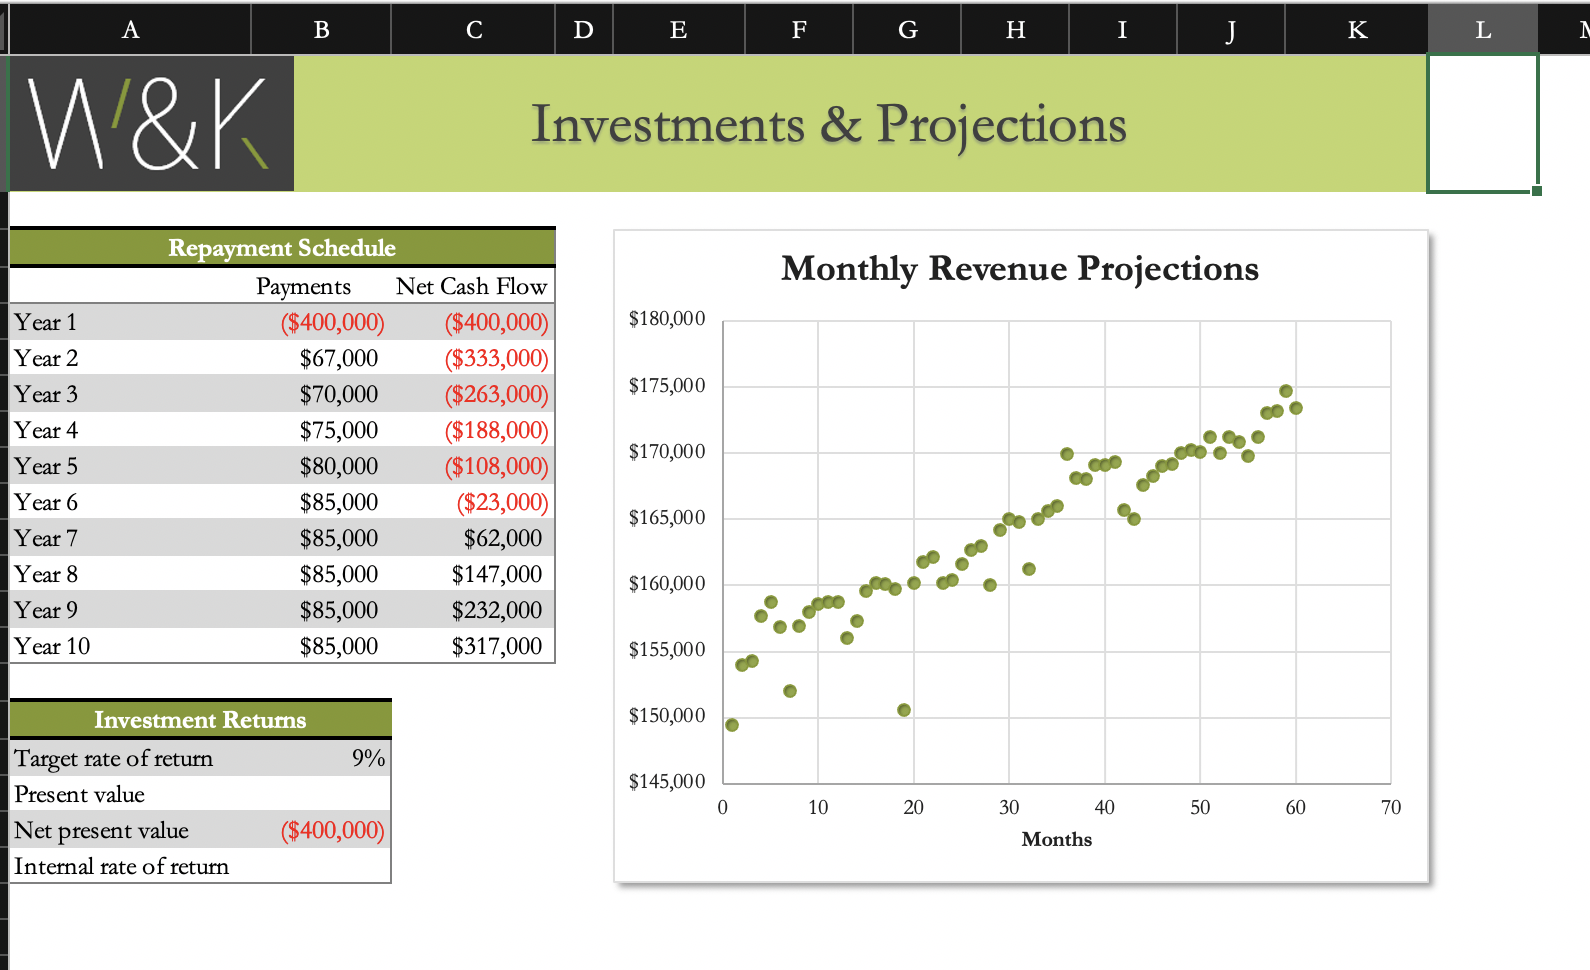
Go to the Investments & Projections worksheet. This worksheet should show the returns potential investors could realize if they invested a total of $400,000 in the company. A desirable rate of return would be 9 percent. The client also estimates the investment would pay different amounts each year (range B6:B14). Calculate the present value of the investment and the internal rate of return as follows: a. In cell B18, enter a formula that uses the NPV function to calculate the present value of the investment in funding the company's expansion. b. Use the target rate of return value (cell B17) as the rate argument. Use the payments in Years 1-10 (range B5:B14) as the returns paid to investors. (Hint: If a Formula Omits Adjacent Cell error warning appears, ignore it.) C. The Monthly Revenue Projections scatter chart in the range E3:K20 is based on monthly revenue estimates listed on the hidden Monthly Revenue Projections worksheet. Hwan wants to include a trendline for this chart that shows investors how revenues will most likely increase quickly at first and then level off in later months. Modify the Monthly Revenue Projections scatter chart as follows to include a logarithmic trendline: a. Add a Trendline to the Monthly Revenue Projections scatter chart. b. Format the trendline to use the Logarithmic option. A B C D E F G H I J K L N W&K Investments & Projections Monthly Revenue Projections Year 1 $180,000 Year 2 Year 3 $175,000 Year 4 Repayment Schedule Payments Net Cash Flow ($400,000) ($400,000) $67,000 ($333,000) $70,000 ($263,000) $75,000 ($188,000) $80,000 ($108,000) $85,000 ($23,000) $85,000 $62,000 $85,000 $147,000 $85,000 $232,000 $85,000 $317,000 $170,000 $165,000 Year 5 Year 6 Year 7 Year 8 Year 9 $160,000 Year 10 $155,000 of Investment Returns $150,000 9% $145,000 Target rate of return Present value Net present value Internal rate of return 0 10 20 30 40 50 60 70 ($400,000) Months Go to the Investments & Projections worksheet. This worksheet should show the returns potential investors could realize if they invested a total of $400,000 in the company. A desirable rate of return would be 9 percent. The client also estimates the investment would pay different amounts each year (range B6:B14). Calculate the present value of the investment and the internal rate of return as follows: a. In cell B18, enter a formula that uses the NPV function to calculate the present value of the investment in funding the company's expansion. b. Use the target rate of return value (cell B17) as the rate argument. Use the payments in Years 1-10 (range B5:B14) as the returns paid to investors. (Hint: If a Formula Omits Adjacent Cell error warning appears, ignore it.) C. The Monthly Revenue Projections scatter chart in the range E3:K20 is based on monthly revenue estimates listed on the hidden Monthly Revenue Projections worksheet. Hwan wants to include a trendline for this chart that shows investors how revenues will most likely increase quickly at first and then level off in later months. Modify the Monthly Revenue Projections scatter chart as follows to include a logarithmic trendline: a. Add a Trendline to the Monthly Revenue Projections scatter chart. b. Format the trendline to use the Logarithmic option. A B C D E F G H I J K L N W&K Investments & Projections Monthly Revenue Projections Year 1 $180,000 Year 2 Year 3 $175,000 Year 4 Repayment Schedule Payments Net Cash Flow ($400,000) ($400,000) $67,000 ($333,000) $70,000 ($263,000) $75,000 ($188,000) $80,000 ($108,000) $85,000 ($23,000) $85,000 $62,000 $85,000 $147,000 $85,000 $232,000 $85,000 $317,000 $170,000 $165,000 Year 5 Year 6 Year 7 Year 8 Year 9 $160,000 Year 10 $155,000 of Investment Returns $150,000 9% $145,000 Target rate of return Present value Net present value Internal rate of return 0 10 20 30 40 50 60 70 ($400,000) Months