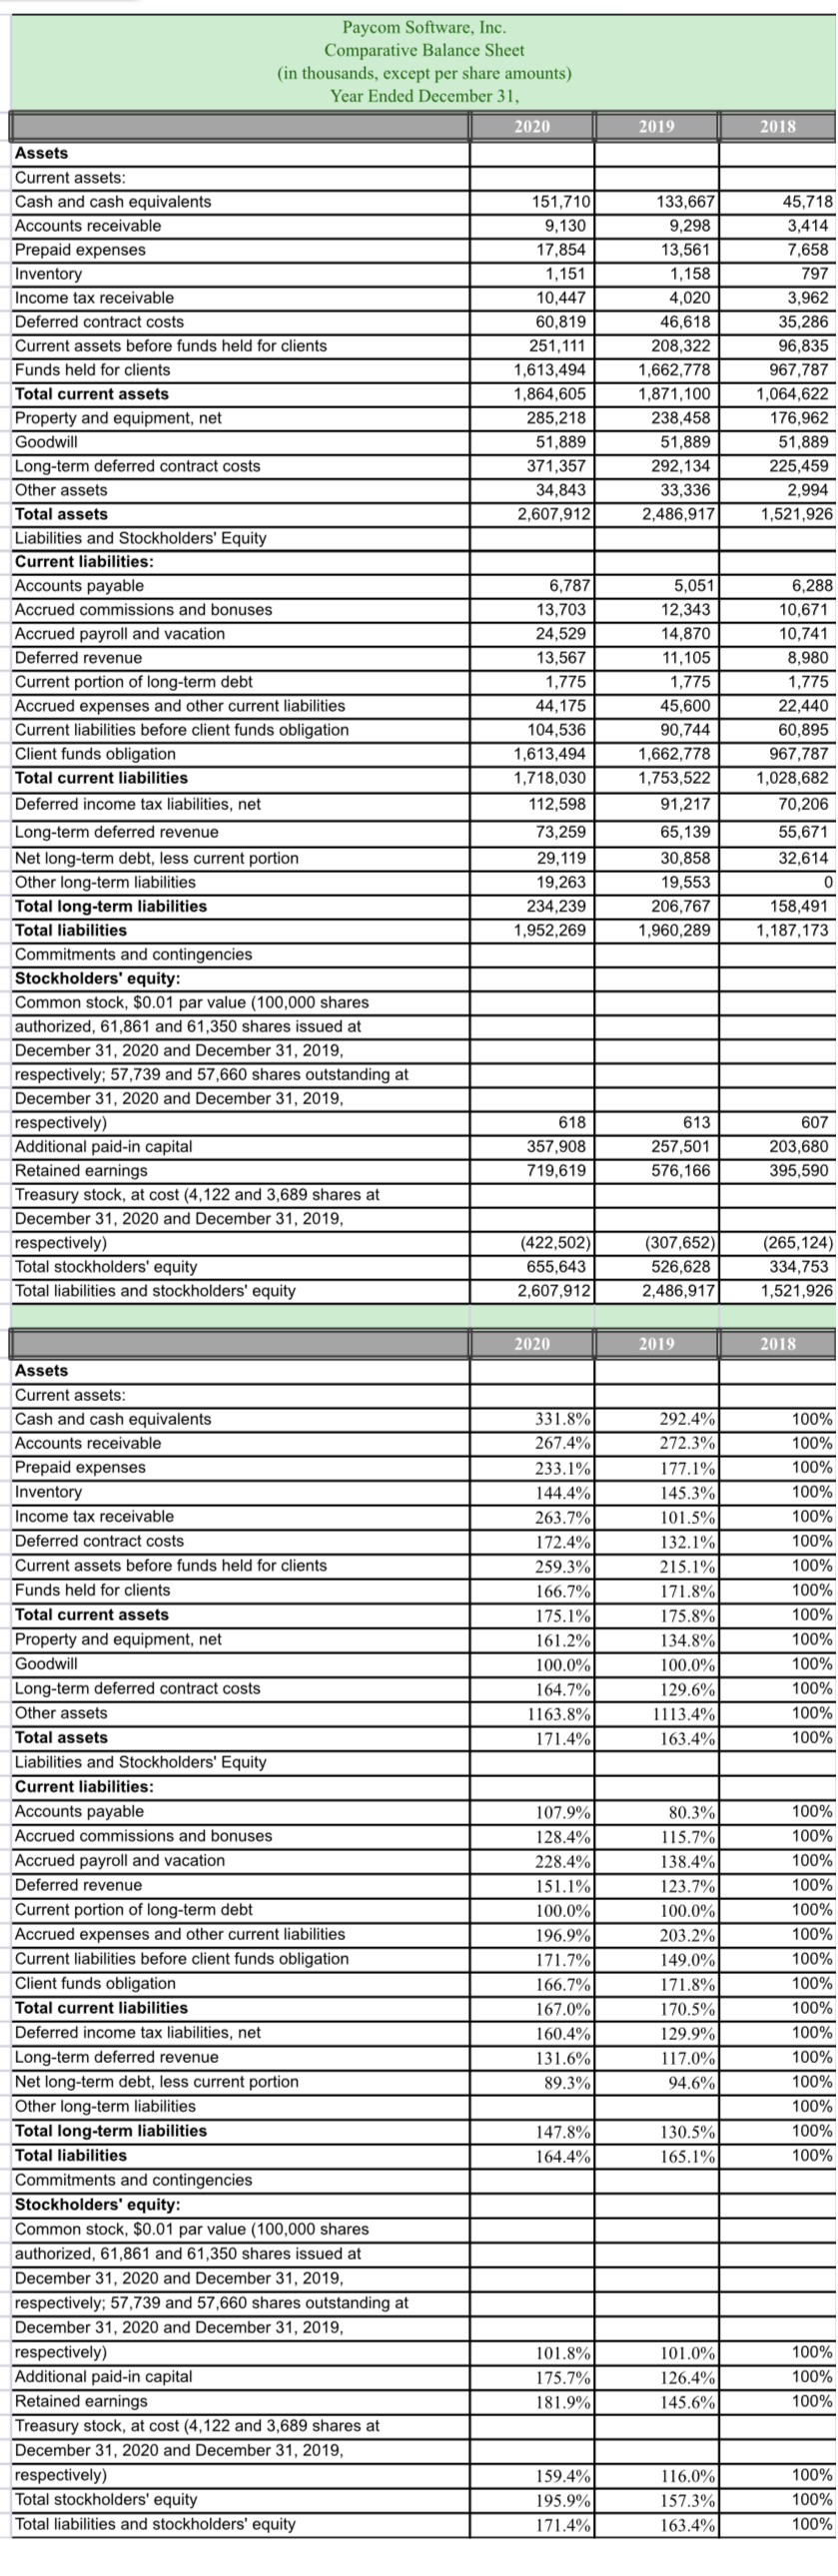
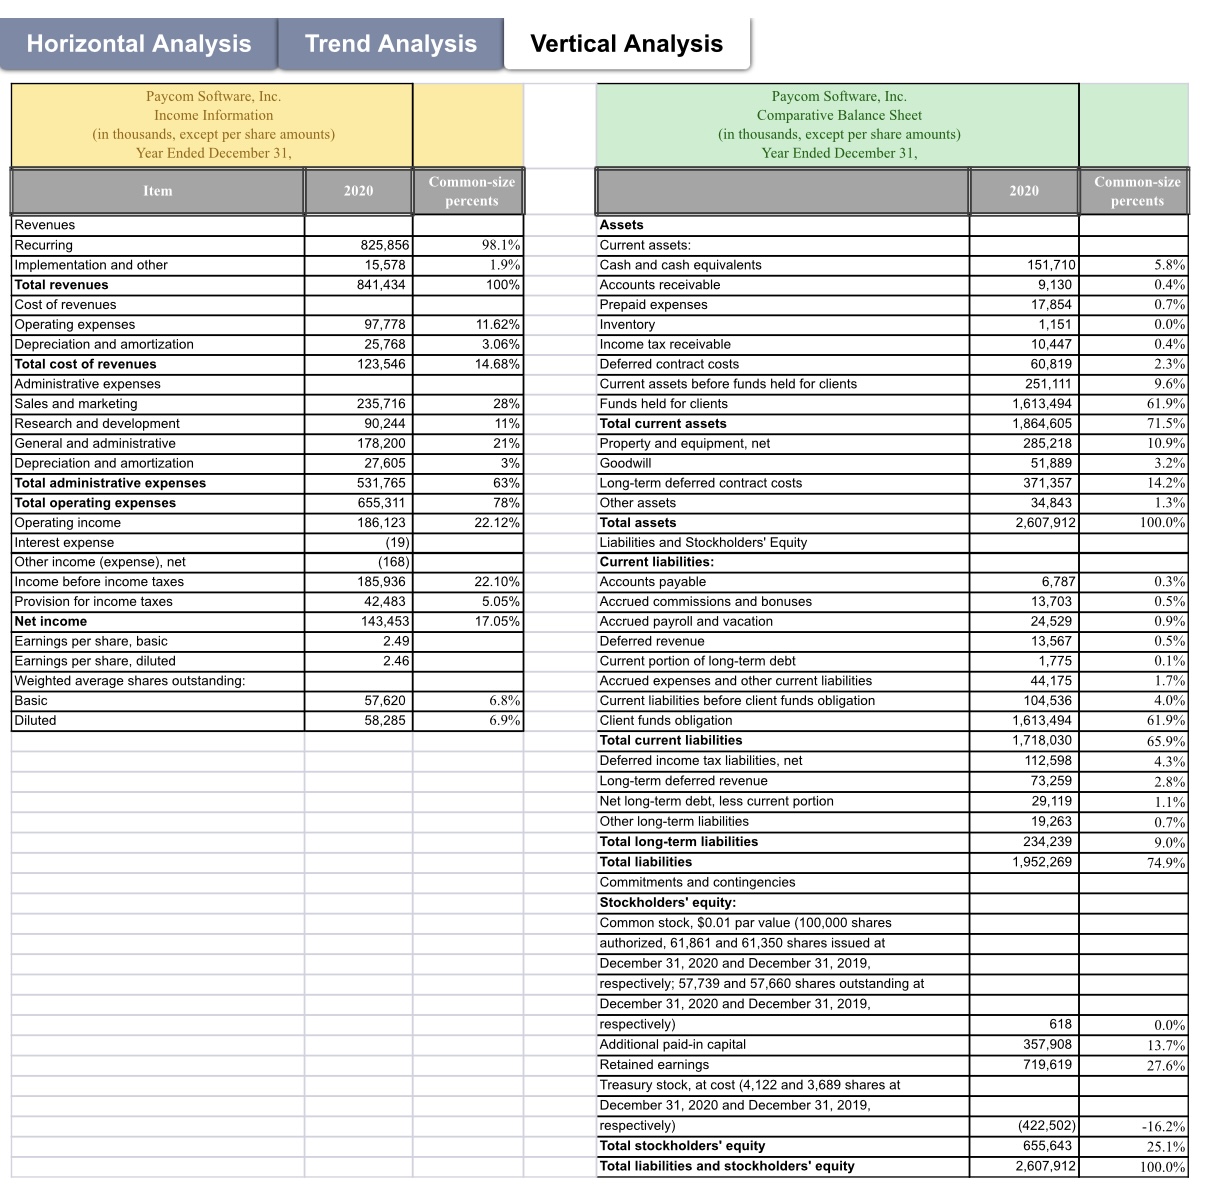
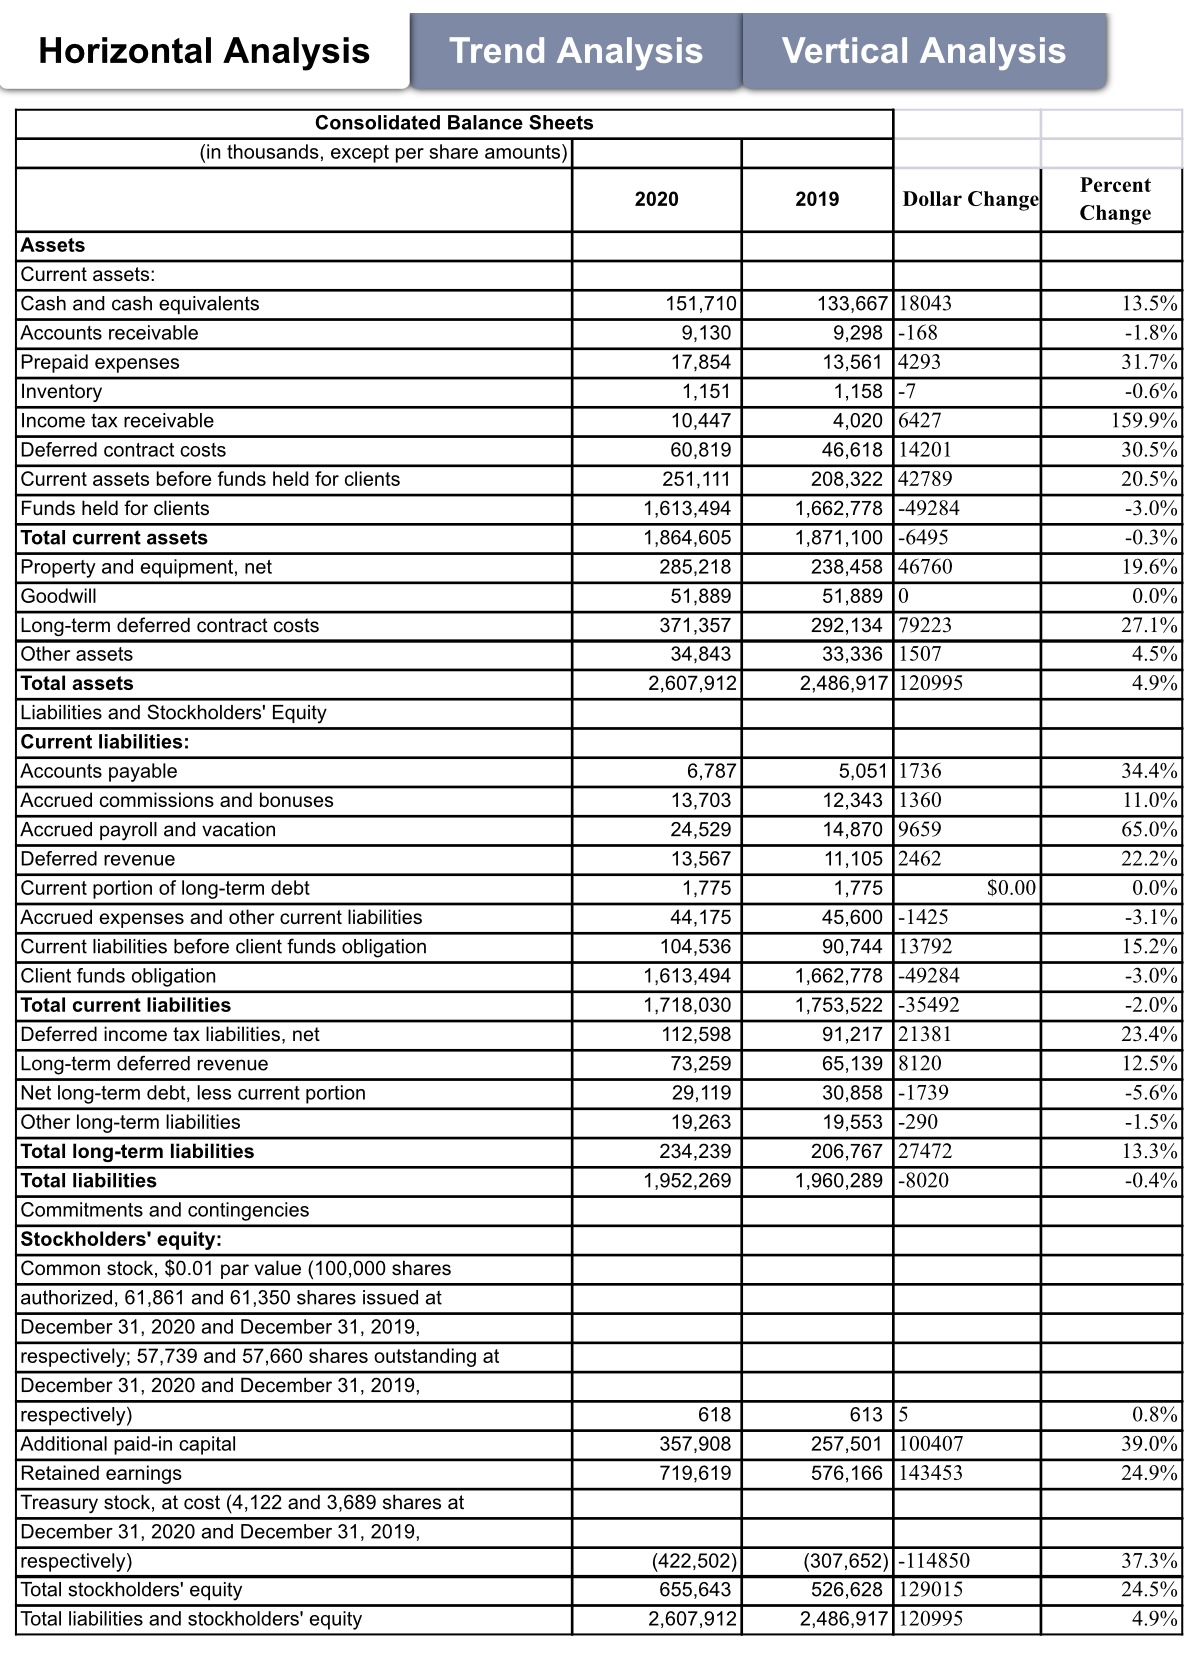
Please provide insights gleaned from analyses (vertical and horizontal analysis) about Paycom's profitability, liquidity, and solvency.
Paycom Software, Inc. Comparative Balance Sheet (in thousands, except per share amounts) Year Ended December 31, 2020 Assets 2019 2018 Current assets: Cash and cash equivalents Accounts receivable 51,710 33,667 45,718 9,130 Prepaid expenses 9,298 3,414 Inventory 17,854 3,561 7,658 1,151 Income tax receivable 1,158 797 Deferred contract cost 10,447 4,020 3,962 60,819 Current assets before funds held for clients 16,618 35,286 Funds held for clients 251, 111 208,322 96,835 Total current assets 1,613,494 ,662,778 967,787 Property and equipment, net 1,864,605 1,871,100 ,064,622 Goodwill 285,218 238,458 176,96 Long-term deferred contract costs 51,889 51,889 51,889 Other assets 71,357 92, 134 225,459 Total assets 34,843 33,336 2,994 Liabilities and Stockholders' Equity 2,607,912 2,486,917 1,521,926 Current liabilities: Accounts payable 6,787 Accrued commissions and bonuses 5,051 6,288 13,703 Accrued payroll and vacation 12,343 10,671 Deferred revenue 24,529 14,870 10,74 13,567 Current portion of long-term debt 1,105 8,980 1,775 Accrued expenses and other current liabilities 1,775 1,775 Current liabilities before client funds 44,175 45,600 22,440 Client funds obligation 104,536 90,744 60,895 Total current liabilities 1,613,494 1,662,778 967,78 ,718,030 Deferred income tax liabilities, net 1,753,522 1,028,682 12,598 91,217 Long-term deferred revenue 0,206 73,25 Net long-term debt, less current portion 65,139 55,671 29,119 Other long-term liabilities 30,858 2,614 Total long-term liabilities 9,263 19.553 Total liabilities 234,239 206,767 158,49 ,952,269 Commitments and contingencies ,960,289 , 187,173 Stockholders' equity Common stock, $0.01 par value (100,000 shares authorized, 61,861 and 61,350 shares issued at December 31, 2020 and December 31, 2019, respectively; 57,739 and 57,660 shares outstanding at December 31, 2020 and December 31, 2019, respectively) Additional paid-in capital 618 613 607 357,908 Retained earnings 257,501 203,680 19,619 Treasury stock, at cost (4, 122 and 3,689 shares at 576,166 395,590 December 31, 2020 and December 31, 2019 respectively) (422,502) Total stockholders' equity 307,652) 265,124 655,643 Total liabilities and stockholders' equity 526,628 334,753 2,607,912 2,486,917 1,521,926 2020 Assets 2019 2018 Current assets: Cash and cash equivalents 331.8% Accounts receivable 292.4% 100% Prepaid expenses 67.4% 272.3% 100% Inventory 233.1% 177.1% 100% Income tax receivable 44.4% 145.3% 100% Deferred contract costs 263.7% 101.5% 100% 172.4% Current assets before funds held for clients 32.1% 100% Funds held for clients 259.3% 215.1% 100% Total current assets 166.7% 171.8% 100% Property and equipment, net 75.1% 175.8% 100% Goodwill 161.2% 134.8% 100% Long-term deferred contract cost 00.0% 100.0% 100% Other assets 64.7% 29.6% 100% Total assets 1163.8% 113.4% 100% 171.4% Liabilities and Stockholders' Equity 163.4% 100% Current liabilities: Accounts payable 107.9% Accrued commissions and bonuses 30.3% 100% Accrued payroll and vacation 28.4% 15.7% 100% 228.4% Deferred revenue 138.4% 100% 151.1% Current portion of long-term debt 23.7% 100% 00.0% Accrued expenses and other current liabilities 100.0% 100% 96.9% Current liabilities before client funds obligation 203.2% 100% Client funds obligation 171.7% 149.0% 100% Total current liabilities 166.7% 171.8% 100% 67.0% Deferred income tax liabilities, net 70.5% 100% 60.4% Long-term deferred revenue 29.9% 100% Net long-term debt, less current portion 131.6% 117.0% 100%% Other long-term liabilities 39.3% 94.6% 100 Total long-term liabilities 100% Total liabilities 47.8% 130.5% 00% 64.4% Commitments and contingencies 165.1% 00% Stockholders' equity Common stock, $0.01 par value (100,000 shares authorized, 61,861 and 61,350 shares issued at December 31, 2020 and December 31, 2019, respectively; 57,739 and 57,660 shares outstanding at December 31, 2020 and December 31, 2019, [respectively) Additional paid-in capital 101.8% 101.0% 100% 75.7% Retained earnings 26.4% 100% 181.9% Treasury stock, at cost (4,122 and 3,689 shares at 145.6% 100 December 31, 2020 and December 31, 2019, respectively) Total stockholders' equity 159.4% 16.0% 100% 95.9% Total liabilities and stockholders' equity 157.3% 100% 71.4% 163.4% 100%Horizontal Analysis Trend Analysis Vertical Analysis Paycom Software, Inc. Income Information Paycom Software, Inc. (in thousands, except per share amounts) Comparative Balance Sheet Year Ended December 31, (in thousands, except per share amounts) Year Ended December 31, Item 2020 Common-size percents 2020 Common-size Revenues percents Assets Recurring 25,856 98.1% Current assets: Implementation and other 15,578 1.9% Total revenue Cash and cash equivalents 341,434 100% 51,710 Accounts receivable 3.8% Cost of revenues 9,130 0.4% Prepaid expenses Operating expenses 97,778 17,854 11.62% 0.7% Inventory |Depreciation and amortization 25,768 3.06% 1,151 0.0% Total cost of revenues Income tax receivable 23,546 4.68% 10,447 0.4% Deferred contract costs Administrative expenses 60,819 2.3% Current assets before funds held for clients Sales and marketing 235,71 251, 111 9.6% 28% Funds held for clients Research and development 90,244 11% 613,494 61.9% Total current assets General and administrative 78,200 21% 864,605 71.5% Property and equipment, net Depreciation and amortization 27,605 3% 285,218 10.9% Goodwill Total administrative expenses 531,765 %89 51,889 3.2% Long-term deferred contract costs Total operating expenses 655,311 78% 371,357 14.2% Other assets Operating income 86, 123 22.12% 34,843 1.3% Total asset Interest expense (19) 2,607,912 100.0% Other income (expense), net Liabilities and Stockholders' Equity (168) Current liabilities Income before income taxes 85,936 22.10% Accounts payable Provision for income taxes 12,483 5.05% 6,787 0.3% Net income Accrued commissions and bonuses 43,45 3,703 7.05% 0.5% Accrued payroll and vacation Earnings per share, basic 2.49 24,529 0.9% Deferred revenue Earnings per share, diluted 2.46 13,567 0.5% Weighted average shares outstanding Current portion of long-term debt 1,775 0.1% Basic Accrued expenses and other current liabilitie 7,620 44,175 6.8% 1.7% Diluted Current liabilities before client funds obligation 58,285 6.9% 04,536 4.0% Client funds obligation ,613,494 61.9% Total current liabilities ,718,030 65.9% Deferred income tax liabilities, net 12,598 4.3% Long-term deferred revenue 3,259 2.8% Net long-term debt, less current portion 29, 119 1.1% Other long-term liabilities 19,263 Total long-term liabilities 0.7% 234,239 9.0% Total liabilities 952,269 74.9% Commitments and contingencies Stockholders' equity: Common stock, $0.01 par value (100,000 shares authorized, 61,861 and 61,350 shares issued a December 31, 2020 and December 31, 2019 respectively; 57,739 and 57,660 shares outstanding at December 31, 2020 and December 31, 2019 respectively) 618 0.0% Additional paid-in capital $57,908 13.7% Retained earnings 719,619 27.6% Treasury stock, at cost (4, 122 and 3,689 shares at December 31, 2020 and December 31, 2019, respectively) 422,502) 16.2% Total stockholders' equity 655,643 25.1% Total liabilities and stockholders' equity 2,607,912 100.0%Horizontal Analysis Trend Analysis Vertical Analysis Consolidated Balance Sheets (in thousands. except per share amounts) Cash and cash equivalents 151.710 133,667 18043 13.5% Accounts receivable 9.130 9,298 -168 -1.8% Prepaid expenses 17,854 13,561 4293 31.7% Inventory 1,151 -0.6% nccme tax receivable 10,447 427 159.9% Deferred contract costs 60,819 4201 30.5% Current assets before funds held for clients 251,111 2789 20.5% Funds held for clients 1,613,494 9284 -3.0% Total current assets 1,564,605 1,871,100 -6495 413% Property and equipment, net 285,218 238,458 46760 19.6% 51,339 0.0% 79223 27.1% 1507 4.5% 120995 4.9% Accounts payable 6,787 Accrued commissions and bonuses 13,703 Accrued payroll and vacation 24,529 Deferred revenue 13,567 Current portion of long-term debt 1.775 Accrued expenses and other current liabilities 44,175 Current liabilities before client funds obligation 104,536 Client funds obligation 1,613,494 Total current liabilities 1,718,030 Deferred income tax liabilities, net 112,598 Long-term deferred revenue 73,259 Net long-term debt, less current portion 29,119 Other long-term liabilities 19,263 Total long-term liabilities 234,239 Total liabilities 1,952,269 Commitments and contingencies Stockholders' equity: Common stock, $0.01 par value (100,000 shares authorized, 61,861 and 61,350 shares issued at December 31, 2020 and December 31, 2019, respectively; 57,739 and 57,660 shares outstanding at December 31, 2020 and December 31, 2019, respectively) Additional paid-in capital Retained earnings Treasury stock. at cost (4,122 and 3,689 shares at December 31, 2020 and December 31, 2019, respectively) (422,502) Total stockholders' equity 655.64 Total liabilities and stockholders' equity 2,607.91 .1 L; 01 CC 4.020 46,618 208,322 1,662,778 4:- 5.051 12,343 14,870 11,105 1,775 45,600 -1425 90,744 13792 1,662,778 49234 1,753,522 -3S492 91,217 1381 120 -1739 36 360 59 462 . \\D 0\\ Ni $0.0 ! b.) 30,858 19,553 -290 206,767 27472 1,960,289 -8020 618 357,908 719,619 00407 43453 257.50 576,16 414850 29015 20995 (307.652) 526,62 2,486.91 t . . an . 9; 3