Please provide the Return on Stockholders Equity = Net Income / Average Total Stockholders Equity based on the information below.
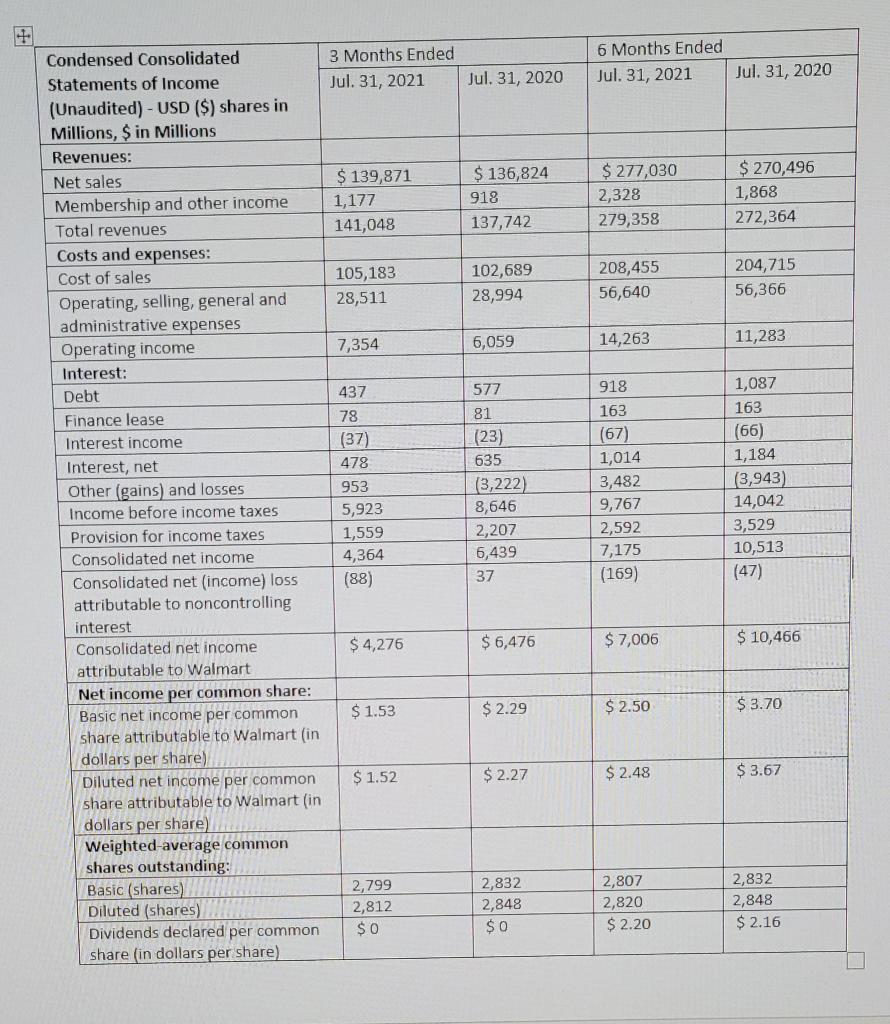
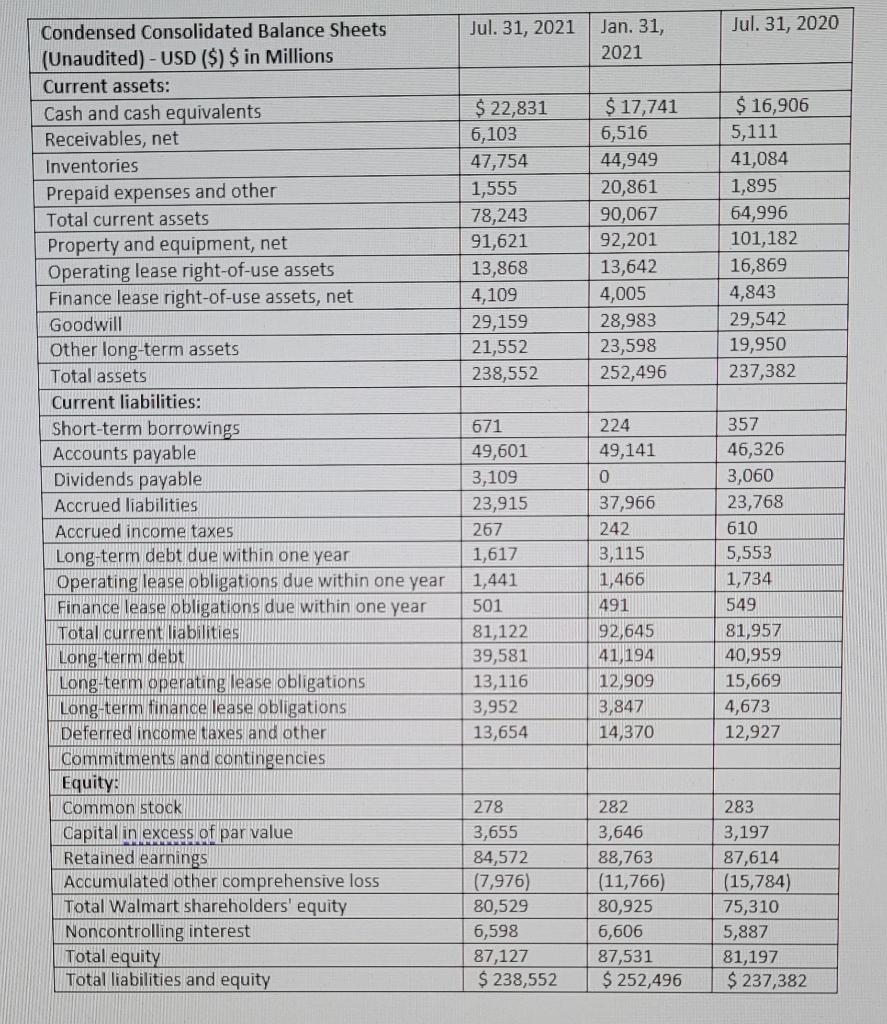
3 Months Ended Jul. 31, 2021 6 Months Ended Jul. 31, 2021 Jul. 31, 2020 Jul. 31, 2020 $ 139,871 1,177 141,048 $ 136,824 918 137,742 $ 277,030 2,328 279,358 $ 270,496 1,868 272,364 204,715 105,183 28,511 102,689 28,994 208,455 56,640 56,366 7,354 6,059 14,263 11,283 Condensed Consolidated Statements of Income (Unaudited) - USD ($) shares in Millions, $ in Millions Revenues: Net sales Membership and other income Total revenues Costs and expenses: Cost of sales Operating, selling, general and administrative expenses Operating income Interest: Debt Finance lease Interest income Interest, net Other (gains) and losses Income before income taxes Provision for income taxes Consolidated net income Consolidated net (income) loss attributable to noncontrolling interest Consolidated net income attributable to Walmart Net income per common share: Basic net income per common share attributable to Walmart in dollars per share) Diluted net income per common share attributable to Walmart (in dollars per share) Weighted average common shares outstanding: Basic (shares) Diluted (shares) Dividends declared per common share (in dollars per share) 437 78 (37) 478 953 5,923 1,559 4,364 577 81 (23) 635 (3,222) 8,646 2,207 6,439 37 918 163 (67) 1,014 3,482 9,767 2,592 7,175 (169) 1,087 163 (66) 1,184 (3,943) 14,042 3,529 10,513 (47) (88) $ 4,276 $ 6,476 $ 7,006 $ 10,466 $ 1.53 $ 2.29 $ 2.50 $ 3.70 $ 1.52 $ 2.27 $ 2.48 $ 3.67 2,799 2,812 $ 0 2,832 2,848 $0 2,807 2,820 $ 2.20 2,832 2,848 $ 2.16 Jul. 31, 2021 Jul. 31, 2020 Jan. 31, 2021 $ 22,831 6,103 47,754 1,555 78,243 91,621 13,868 4,109 29,159 21,552 238,552 $ 17,741 6,516 44,949 20,861 90,067 92,201 13,642 4,005 28,983 23,598 252,496 $ 16,906 5,111 41,084 1,895 64,996 101,182 16,869 4,843 29,542 19,950 237,382 Condensed Consolidated Balance Sheets (Unaudited) - USD ($) $ in Millions Current assets: Cash and cash equivalents Receivables, net Inventories Prepaid expenses and other Total current assets Property and equipment, net Operating lease right-of-use assets Finance lease right-of-use assets, net Goodwill Other long-term assets Total assets Current liabilities: Short-term borrowings Accounts payable Dividends payable Accrued liabilities Accrued income taxes Long-term debt due within one year Operating lease obligations due within one year Finance lease obligations due within one year Total current liabilities Long-term debt Long-term operating lease obligations Long-term finance lease obligations Deferred income taxes and other Commitments and contingencies Equity: Common stock Capital in excess of par value Retained earnings Accumulated other comprehensive loss Total Walmart shareholders' equity Noncontrolling interest Total equity Total liabilities and equity 671 49,601 3,109 23,915 267 1,617 1,441 501 81,122 39,581 13,116 3,952 13,654 224 49,141 0 37,966 242 3,115 1,466 491 92,645 41,194 12,909 3,847 14,370 357 46,326 3,060 23,768 610 5,553 1,734 549 81,957 40,959 15,669 4,673 12,927 278 3,655 84,572 (7,976) 80,529 6,598 87,127 $ 238,552 282 3,646 88,763 (11,766) 80,925 6,606 87,531 $ 252,496 283 3,197 87,614 (15,784) 75,310 5,887 81,197 $ 237,382 3 Months Ended Jul. 31, 2021 6 Months Ended Jul. 31, 2021 Jul. 31, 2020 Jul. 31, 2020 $ 139,871 1,177 141,048 $ 136,824 918 137,742 $ 277,030 2,328 279,358 $ 270,496 1,868 272,364 204,715 105,183 28,511 102,689 28,994 208,455 56,640 56,366 7,354 6,059 14,263 11,283 Condensed Consolidated Statements of Income (Unaudited) - USD ($) shares in Millions, $ in Millions Revenues: Net sales Membership and other income Total revenues Costs and expenses: Cost of sales Operating, selling, general and administrative expenses Operating income Interest: Debt Finance lease Interest income Interest, net Other (gains) and losses Income before income taxes Provision for income taxes Consolidated net income Consolidated net (income) loss attributable to noncontrolling interest Consolidated net income attributable to Walmart Net income per common share: Basic net income per common share attributable to Walmart in dollars per share) Diluted net income per common share attributable to Walmart (in dollars per share) Weighted average common shares outstanding: Basic (shares) Diluted (shares) Dividends declared per common share (in dollars per share) 437 78 (37) 478 953 5,923 1,559 4,364 577 81 (23) 635 (3,222) 8,646 2,207 6,439 37 918 163 (67) 1,014 3,482 9,767 2,592 7,175 (169) 1,087 163 (66) 1,184 (3,943) 14,042 3,529 10,513 (47) (88) $ 4,276 $ 6,476 $ 7,006 $ 10,466 $ 1.53 $ 2.29 $ 2.50 $ 3.70 $ 1.52 $ 2.27 $ 2.48 $ 3.67 2,799 2,812 $ 0 2,832 2,848 $0 2,807 2,820 $ 2.20 2,832 2,848 $ 2.16 Jul. 31, 2021 Jul. 31, 2020 Jan. 31, 2021 $ 22,831 6,103 47,754 1,555 78,243 91,621 13,868 4,109 29,159 21,552 238,552 $ 17,741 6,516 44,949 20,861 90,067 92,201 13,642 4,005 28,983 23,598 252,496 $ 16,906 5,111 41,084 1,895 64,996 101,182 16,869 4,843 29,542 19,950 237,382 Condensed Consolidated Balance Sheets (Unaudited) - USD ($) $ in Millions Current assets: Cash and cash equivalents Receivables, net Inventories Prepaid expenses and other Total current assets Property and equipment, net Operating lease right-of-use assets Finance lease right-of-use assets, net Goodwill Other long-term assets Total assets Current liabilities: Short-term borrowings Accounts payable Dividends payable Accrued liabilities Accrued income taxes Long-term debt due within one year Operating lease obligations due within one year Finance lease obligations due within one year Total current liabilities Long-term debt Long-term operating lease obligations Long-term finance lease obligations Deferred income taxes and other Commitments and contingencies Equity: Common stock Capital in excess of par value Retained earnings Accumulated other comprehensive loss Total Walmart shareholders' equity Noncontrolling interest Total equity Total liabilities and equity 671 49,601 3,109 23,915 267 1,617 1,441 501 81,122 39,581 13,116 3,952 13,654 224 49,141 0 37,966 242 3,115 1,466 491 92,645 41,194 12,909 3,847 14,370 357 46,326 3,060 23,768 610 5,553 1,734 549 81,957 40,959 15,669 4,673 12,927 278 3,655 84,572 (7,976) 80,529 6,598 87,127 $ 238,552 282 3,646 88,763 (11,766) 80,925 6,606 87,531 $ 252,496 283 3,197 87,614 (15,784) 75,310 5,887 81,197 $ 237,382