Answered step by step
Verified Expert Solution
Question
1 Approved Answer
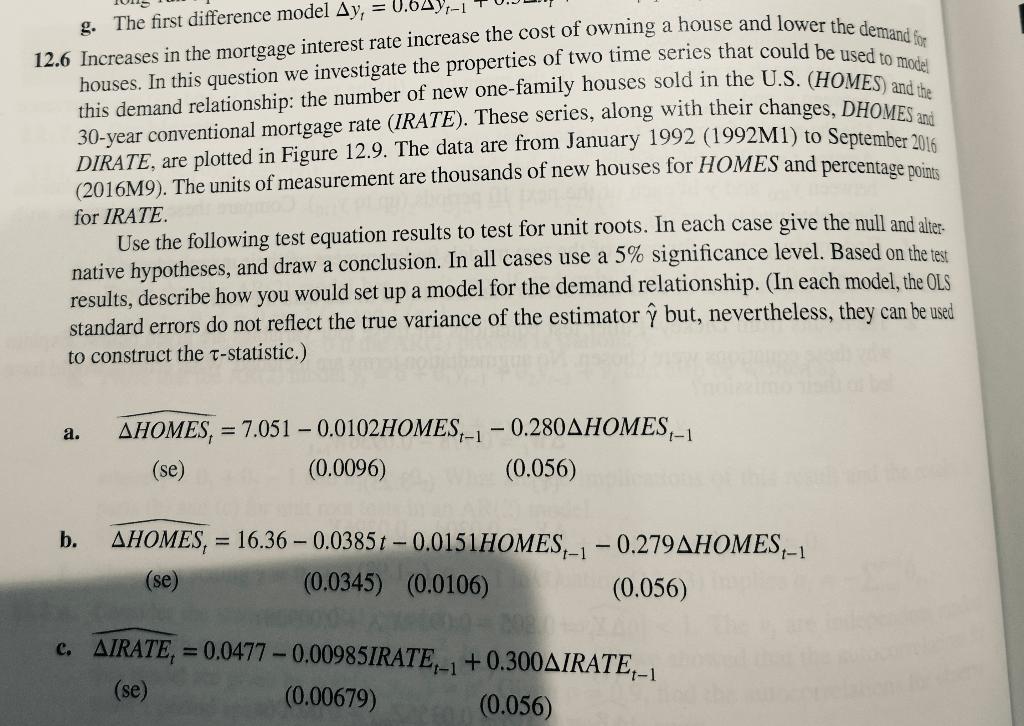
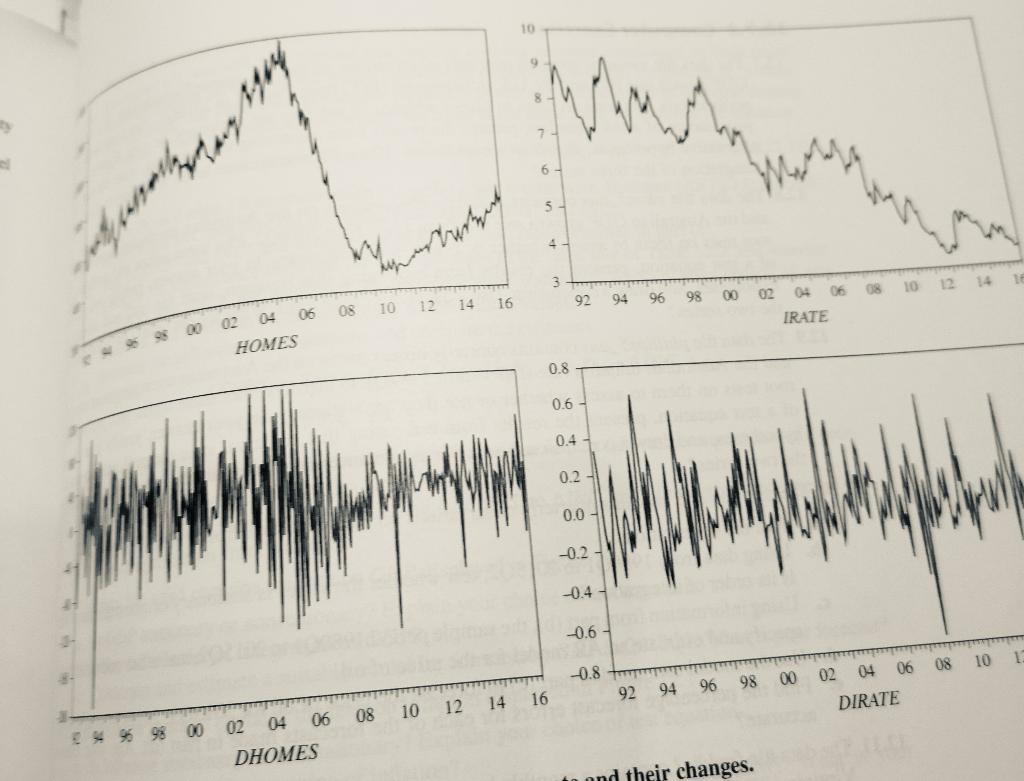
Please refer to the question parts a, b, and c and figures above. Thank you! g. The first difference model Ay, = 0.64y-1 12.6 Increases


Please refer to the question parts a, b, and c and figures above. Thank you!
g. The first difference model Ay, = 0.64y-1 12.6 Increases in the mortgage interest rate increase the cost of owning a house and lower the demand for houses. In this question we investigate the properties of two time series that could be used to model this demand relationship: the number of new one-family houses sold in the U.S. (HOMES) and the 30-year conventional mortgage rate (IRATE). These series, along with their changes, DHOMES 28 DIRATE, are plotted in Figure 12.9. The data are from January 1992 (1992M1) to September 2016 (2016M9). The units of measurement are thousands of new houses for HOMES and percentage points for IRATE. Use the following test equation results to test for unit roots. In each case give the null and alter- native hypotheses, and draw a conclusion. In all cases use a 5% significance level. Based on the test results, describe how you would set up a model for the demand relationship. (In each model, the OLS standard errors do not reflect the true variance of the estimator but, nevertheless, they can be used to construct the T-statistic.) a. AHOMES, = 7.051 0.0102HOMES-1 -0.280AHOMES-1 (se) (0.0096) (0.056) b. = - AHOMES, (se) 16.36 0.0385t -0.0151HOMES-1 -0.279AHOMES-1 (0.0345) (0.0106) (0.056) c. AIRATE, = 0.0477 -0.00985IRATE-1 +0.300AIRATE,-1 (se) (0.00679) (0.056) 10 7 6- 5 4- je ponelayan 3704 harest 3 TE 98 94 96 92 00 14 16 10 12 08 02 04 06 08 IRATE 06 02 04 HOMES 0.8 0.6 0.4 0.2 0.0 -0.2- -0.4 -0.6 10 -0.8 96 98 02 04 06 08 00 94 92 DIRATE 02 04 06 08 10 12 14 16 * % 98 00 DHOMES in and their changes. g. The first difference model Ay, = 0.64y-1 12.6 Increases in the mortgage interest rate increase the cost of owning a house and lower the demand for houses. In this question we investigate the properties of two time series that could be used to model this demand relationship: the number of new one-family houses sold in the U.S. (HOMES) and the 30-year conventional mortgage rate (IRATE). These series, along with their changes, DHOMES 28 DIRATE, are plotted in Figure 12.9. The data are from January 1992 (1992M1) to September 2016 (2016M9). The units of measurement are thousands of new houses for HOMES and percentage points for IRATE. Use the following test equation results to test for unit roots. In each case give the null and alter- native hypotheses, and draw a conclusion. In all cases use a 5% significance level. Based on the test results, describe how you would set up a model for the demand relationship. (In each model, the OLS standard errors do not reflect the true variance of the estimator but, nevertheless, they can be used to construct the T-statistic.) a. AHOMES, = 7.051 0.0102HOMES-1 -0.280AHOMES-1 (se) (0.0096) (0.056) b. = - AHOMES, (se) 16.36 0.0385t -0.0151HOMES-1 -0.279AHOMES-1 (0.0345) (0.0106) (0.056) c. AIRATE, = 0.0477 -0.00985IRATE-1 +0.300AIRATE,-1 (se) (0.00679) (0.056) 10 7 6- 5 4- je ponelayan 3704 harest 3 TE 98 94 96 92 00 14 16 10 12 08 02 04 06 08 IRATE 06 02 04 HOMES 0.8 0.6 0.4 0.2 0.0 -0.2- -0.4 -0.6 10 -0.8 96 98 02 04 06 08 00 94 92 DIRATE 02 04 06 08 10 12 14 16 * % 98 00 DHOMES in and their changesStep by Step Solution
There are 3 Steps involved in it
Step: 1

Get Instant Access to Expert-Tailored Solutions
See step-by-step solutions with expert insights and AI powered tools for academic success
Step: 2

Step: 3

Ace Your Homework with AI
Get the answers you need in no time with our AI-driven, step-by-step assistance
Get Started


