Answered step by step
Verified Expert Solution
Question
1 Approved Answer
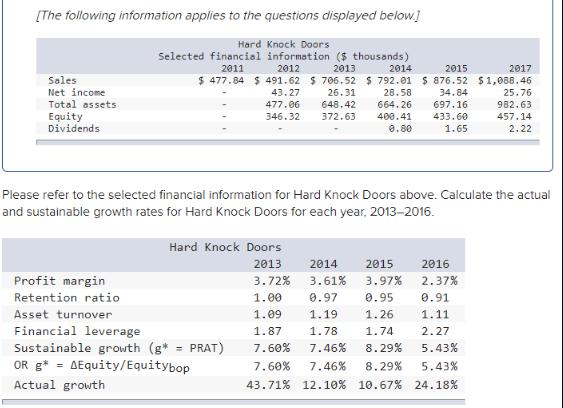
[The following information applies to the questions displayed below] Hard Knock Doors Selected financial information ($ thousands) 2011 2012 2013 2014 2015 2017 $

![]()
![]()
[The following information applies to the questions displayed below] Hard Knock Doors Selected financial information ($ thousands) 2011 2012 2013 2014 2015 2017 $ 477.84 $ 491.62 $ 706.52 $ 792.01 $ 876.52 $1,088.46 Sales Net income Total assets 43.27 26.31 28.58 34.84 25.76 477.06 648.42 664. 26 697.16 982.63 Equity Dividends 346.32 372.63 400.41 433.60 457.14 0.80 1.65 2.22 Please refer to the selected financial information for Hard Knock Doors above. Calculate the actual and sustainable growth rates for Hard Knock Doors for each year, 2013-2016. Hard Knock Doors 2013 2014 2015 2016 Profit margin 3.72% 3.61% 3.97% 2.37% Retention ratio 1.00 0.97 0.95 0.91 Asset turnover 1.09 1.19 1.26 1.11 Financial leverage Sustainable growth (g* OR g* = AEquity/Equitybop 1.87 1.78 1.74 2.27 PRAT) 7.60% 7.46% 8.29% 5.43% 7.60% 7.46% 8.29% 5.43% Actual growth 43.71% 12.10% 10.67% 24.18% Please refer to the selected financial information for Hard Knock Doors above. Do you think Hard Knock Doors is having a problem financing its growth? If so, what is it doing to address the problem? Please refer to the selected financial information for Hard Knock Doors above. Is the increase in dividends between 2013 and 2016 a good idea for Hard Knock Doors?
Step by Step Solution
★★★★★
3.45 Rating (171 Votes )
There are 3 Steps involved in it
Step: 1
All the Answers are given below 1 Year Calculation Growth rate 2012 491624778447784100 288 2013 7065...
Get Instant Access to Expert-Tailored Solutions
See step-by-step solutions with expert insights and AI powered tools for academic success
Step: 2

Step: 3

Ace Your Homework with AI
Get the answers you need in no time with our AI-driven, step-by-step assistance
Get Started


