Please respond to support the discussion post
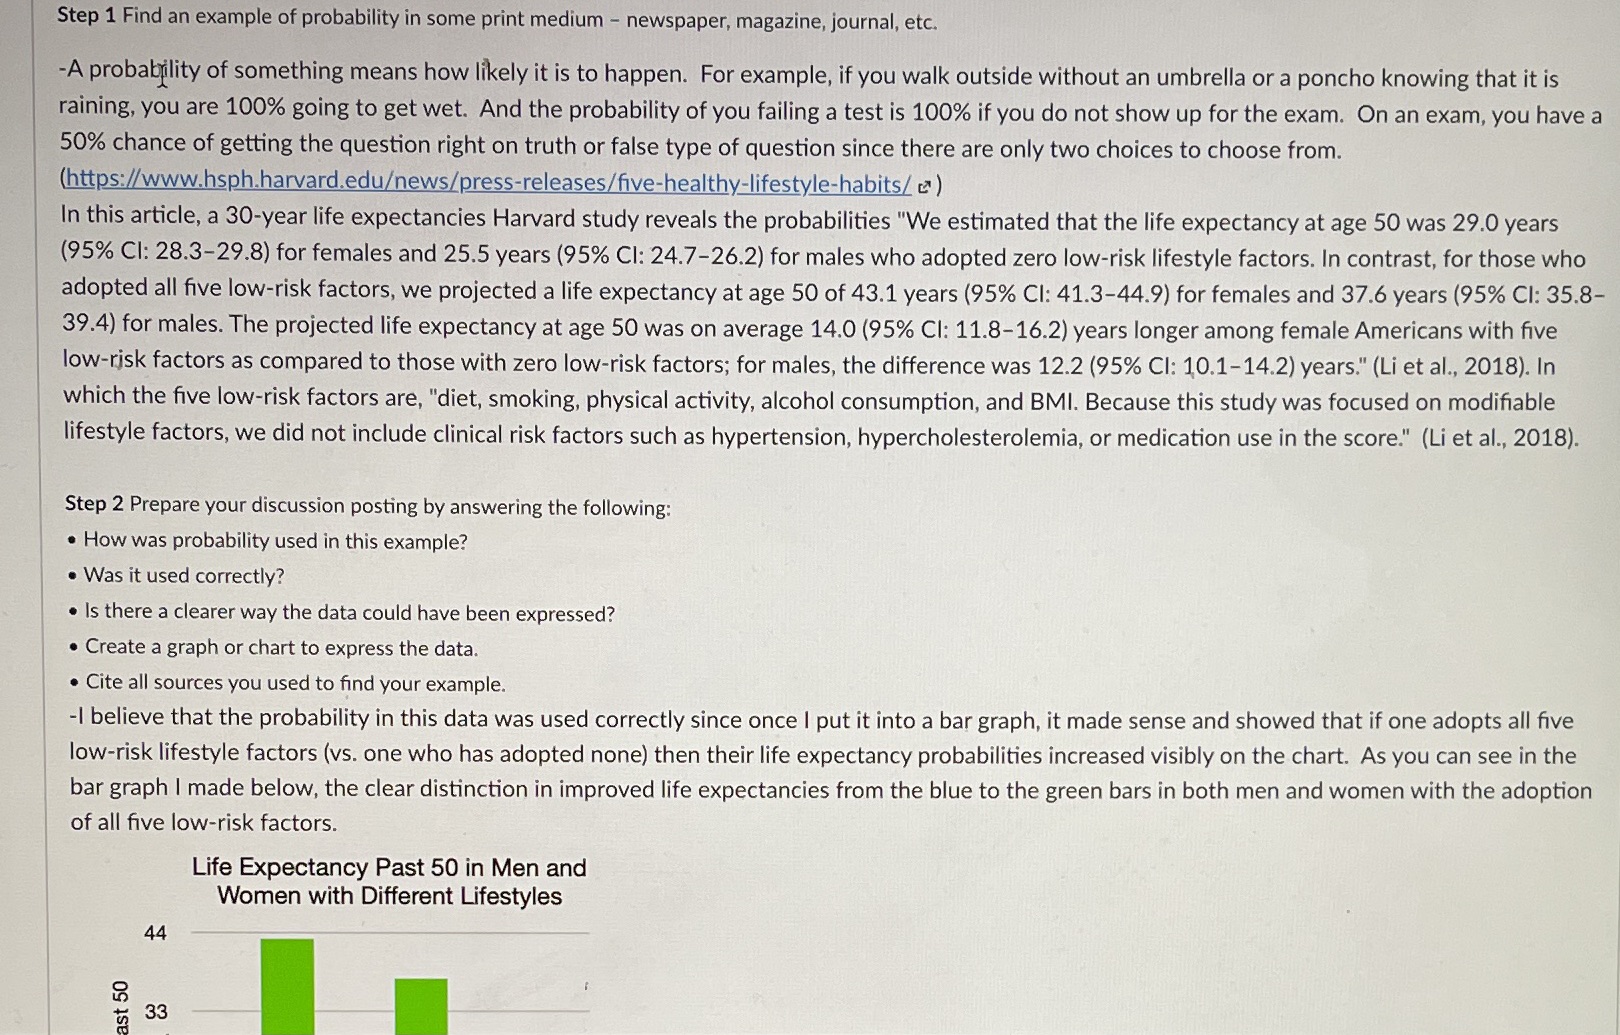
Step 1 Find an example of probability in some print medium - newspaper, magazine, journal, etc. -A probability of something means how likely it is to happen. For example, if you walk outside without an umbrella or a poncho knowing that it is raining, you are 100% going to get wet. And the probability of you failing a test is 100% if you do not show up for the exam. On an exam, you have a 50% chance of getting the question right on truth or false type of question since there are only two choices to choose from. (https://www.hsph.harvard.eduews/press-releases/five-healthy-lifestyle-habits/c ) In this article, a 30-year life expectancyes Harvard study reveals the probabilities "We estimated that the life expectancy at age 50 was 29.0 years (95% CI: 28.3-29.8) for females and 25.5 years (95% Cl: 24.7-26.2) for males who adopted zero low-risk lifestyle factors. In contrast, for those who adopted all five low-risk factors, we projected a life expectancy at age 50 of 43.1 years (95% CI: 41.3-44.9) for females and 37.6 years (95% Cl: 35.8- 39.4) for males. The projected life expectancy at age 50 was on average 14.0 (95% CI: 11.8-16.2) years longer among female Americans with five low-risk factors as compared to those with zero low-risk factors; for males, the difference was 12.2 (95% CI: 10.1-14.2) years." (Li et al., 2018). In which the five low-risk factors are, "diet, smoking, physical activity, alcohol consumption, and BMI. Because this study was focused on modifiable lifestyle factors, we did not include clinical risk factors such as hypertension, hypercholesterolemia, or medication use in the score." (Li et al., 2018). Step 2 Prepare your discussion posting by answering the following: . How was probability used in this example? . Was it used correctly? . Is there a clearer way the data could have been expressed? . Create a graph or chart to express the data. . Cite all sources you used to find your example. -I believe that the probability in this data was used correctly since once I put it into a bar graph, it made sense and showed that if one adopts all five low-risk lifestyle factors (vs. one who has adopted none) then their life expectancy probabilities increased visibly on the chart. As you can see in the bar graph I made below, the clear distinction in improved life expectancyes from the blue to the green bars in both men and women with the adoption of all five low-risk factors. Life Expectancy Past 50 in Men and Women with Different Lifestyles 44 ist 50 33