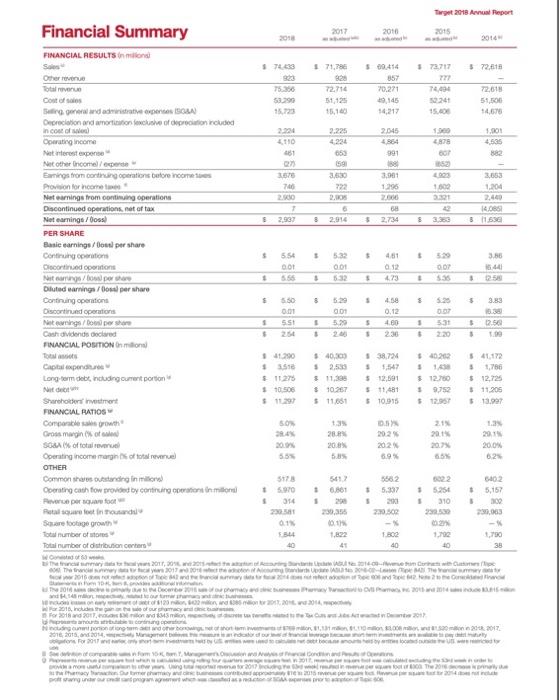
Please search for "Target Corporation's Fiscal 2018 Annual Report" on google as I am not allowed to include a link.
1) Calculate the rate of return on total assets for Target Corporation for the year ended February 2, 2019.
2) Compare Target Corporations rate of return on total assets to Kohls Corporations ratio. Discuss the differences.
Torget 2018 Report 2017 2016 2015 Financial Summary FINANCIAL RESULTS in more TOS 172.717 572,615 Othere 71.79 828 72.714 51125 15.10 7550 53.290 15.723 500414 857 70,271 10,145 14,217 T4.094 72.618 51,500 14,676 2:34 4110 481 2.225 4234 2.045 4564 991 1000 2878 OP 1.00 4.535 159 3.60 222 DAS 3.001 1296 2009 1600 3670 70 2.50 7 1204 Cost of Stand des SA Depreciation and amortion focuse of included ncor al alan Operating income Neret expense Net other Income/experte Baigs tronco operation before come Provision for income Net amnings from continuing operations Discontinued operations.net of tax Niet earnings / Goos PER SHARE Basic earnings / Boul per share Continuing operation Encored Octors Nitong/operere Diluted earnings / per share Continuing operation Discontinued operations Not owning / opere Cash dividends declared FINANCIAL POSITION 14.085 3 11.636 8 8 2.914 5 8 $ 5 5.54 DOT 5.56 532 GOT 4.51 0.12 3.56 141 OP 1 $ 5 . 3 $ 5 $ 5.25 3.83 0.01 5.51 529 001 5.29 4.58 0.12 4.80 230 1 5 . $ . 5 $40.33 40202 11290 1 3.51 11275 $10.506 38.72M S 5,547 $ 12,591 511481 510915 541.172 5,786 $ 12,725 $11.205 $13.997 $ 12.750 5 9.752 $ 12.95 # 10267 $11.661 SON 1. 21 2015 28 20.8% Cataloni Long-term dett, nude curent portion Shareholder investment FINANCIAL PATIOS Comentarowth Gross mains of SOBA of total revel Operating income margin of total revenue OTHER Commons raining Corting cath tow provided by continuing operations in millor Pere per Rutalowe fot into Sare footage grown total number of Total number of distribution Center 202 202 6.9% 20.0% 62 55% 602 $ 5,157 5178 541 15.970 0.861 . 314 2011 230,36 5562 $ 5,337 5:25 310 220.502 2 1.B 40 10 290063 1.790 The truth, 20 2017 Soome TO IND 0 14 120.20 2016 Industry 18 10 2017 Negro 2016, For 2017 fm 2017 2015 w program SAR Torget 2018 Report 2017 2016 2015 Financial Summary FINANCIAL RESULTS in more TOS 172.717 572,615 Othere 71.79 828 72.714 51125 15.10 7550 53.290 15.723 500414 857 70,271 10,145 14,217 T4.094 72.618 51,500 14,676 2:34 4110 481 2.225 4234 2.045 4564 991 1000 2878 OP 1.00 4.535 159 3.60 222 DAS 3.001 1296 2009 1600 3670 70 2.50 7 1204 Cost of Stand des SA Depreciation and amortion focuse of included ncor al alan Operating income Neret expense Net other Income/experte Baigs tronco operation before come Provision for income Net amnings from continuing operations Discontinued operations.net of tax Niet earnings / Goos PER SHARE Basic earnings / Boul per share Continuing operation Encored Octors Nitong/operere Diluted earnings / per share Continuing operation Discontinued operations Not owning / opere Cash dividends declared FINANCIAL POSITION 14.085 3 11.636 8 8 2.914 5 8 $ 5 5.54 DOT 5.56 532 GOT 4.51 0.12 3.56 141 OP 1 $ 5 . 3 $ 5 $ 5.25 3.83 0.01 5.51 529 001 5.29 4.58 0.12 4.80 230 1 5 . $ . 5 $40.33 40202 11290 1 3.51 11275 $10.506 38.72M S 5,547 $ 12,591 511481 510915 541.172 5,786 $ 12,725 $11.205 $13.997 $ 12.750 5 9.752 $ 12.95 # 10267 $11.661 SON 1. 21 2015 28 20.8% Cataloni Long-term dett, nude curent portion Shareholder investment FINANCIAL PATIOS Comentarowth Gross mains of SOBA of total revel Operating income margin of total revenue OTHER Commons raining Corting cath tow provided by continuing operations in millor Pere per Rutalowe fot into Sare footage grown total number of Total number of distribution Center 202 202 6.9% 20.0% 62 55% 602 $ 5,157 5178 541 15.970 0.861 . 314 2011 230,36 5562 $ 5,337 5:25 310 220.502 2 1.B 40 10 290063 1.790 The truth, 20 2017 Soome TO IND 0 14 120.20 2016 Industry 18 10 2017 Negro 2016, For 2017 fm 2017 2015 w program SAR


