

Answered step by step
Verified Expert Solution
Question
1 Approved Answer
Please see image below for the table.... The chart data are displayed below for your info...thank you much Balance Sheets as of December 31 ,
Please see image below for the table....
The chart data are displayed below for your info...thank you much
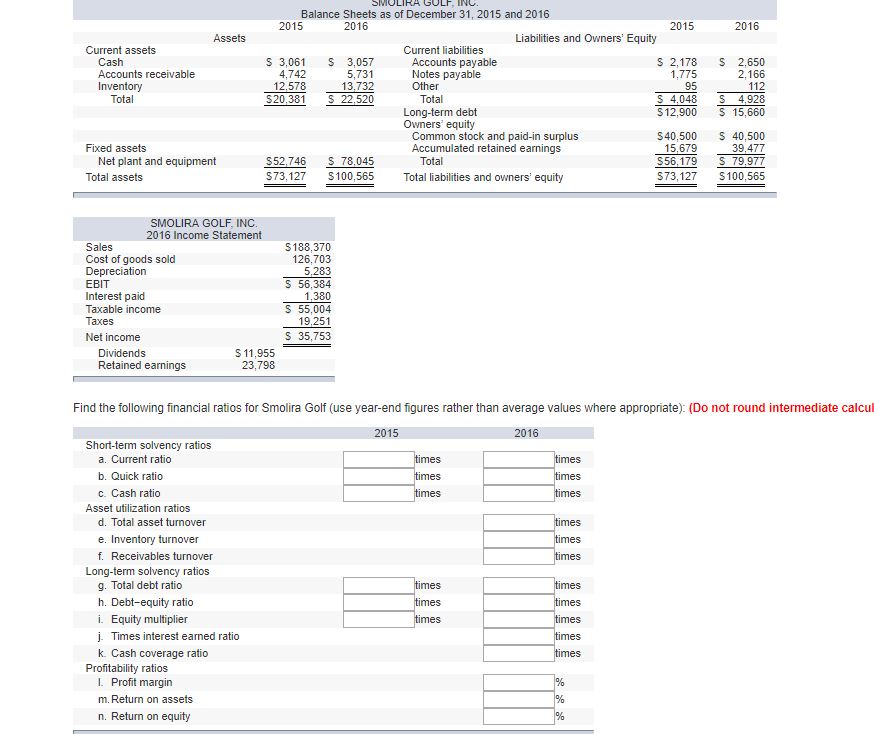
Balance Sheets as of December 31 , 2015 and 2016 Current assets Cash Accounts receivable Inventory Total Fixed assets Net plant and equipment 201S s 3,061 4,742 12878 S20 381 ss2 746 S73127 2016 3,057 5,731 13 732 22 520 s 78045 Sloo,sss Liabilities and Owners: Equity Current liabilities Accounts payable Notes payable Total Long-term debt Owners' equity Common stock and paid-in surplus Accumulated retained earnings Total Total liabilities and cwtners: equity 201S s 2,178 1,775 S 4048 s 12,900 S40soo 15879 179 573, 127 2016 2,650 2, 166 4 928 s 15,660 40,500 39 477 s 79977 Sloo,sss Total assets Sales SMOLIACOLF, 2016 Income Statement Cost of goods sold Depreciation EBIT Interest paid Taxable income Taxes Net income Oividends Retained eamings 518&370 126,703 s 283 s 56,384 1 380 s ss,004 19 251 s 35,753 s 11,9ss 23,798 Find the following financial ratios for Smolira Golf (use year-end figures rather than average values where appropriate): (Do not round intermediate calcul Short-term solvency ratios Current ratio b Quick ratio c. Cash ratio Asset utilization ratios Total asset tumover Inventory turnover f Receivables turnover Long-term solvency ratios Total debt ratio Oebtequity ratio i. Equity multiplier j. Times interest eamed ratio k. Cash coverage ratio Profitability ratios I. Profit margin m Retum on assets m Retum on equity mes mes mes mes
Step by Step Solution
There are 3 Steps involved in it
Step: 1

Get Instant Access to Expert-Tailored Solutions
See step-by-step solutions with expert insights and AI powered tools for academic success
Step: 2

Step: 3
Ace Your Homework with AI
Get the answers you need in no time with our AI-driven, step-by-step assistance
Get Started
Financial Markets And Institutions
Authors: Frederic S. Mishkin, Stanley G. Eakins
9th Edition
0134519264, 9780134519265