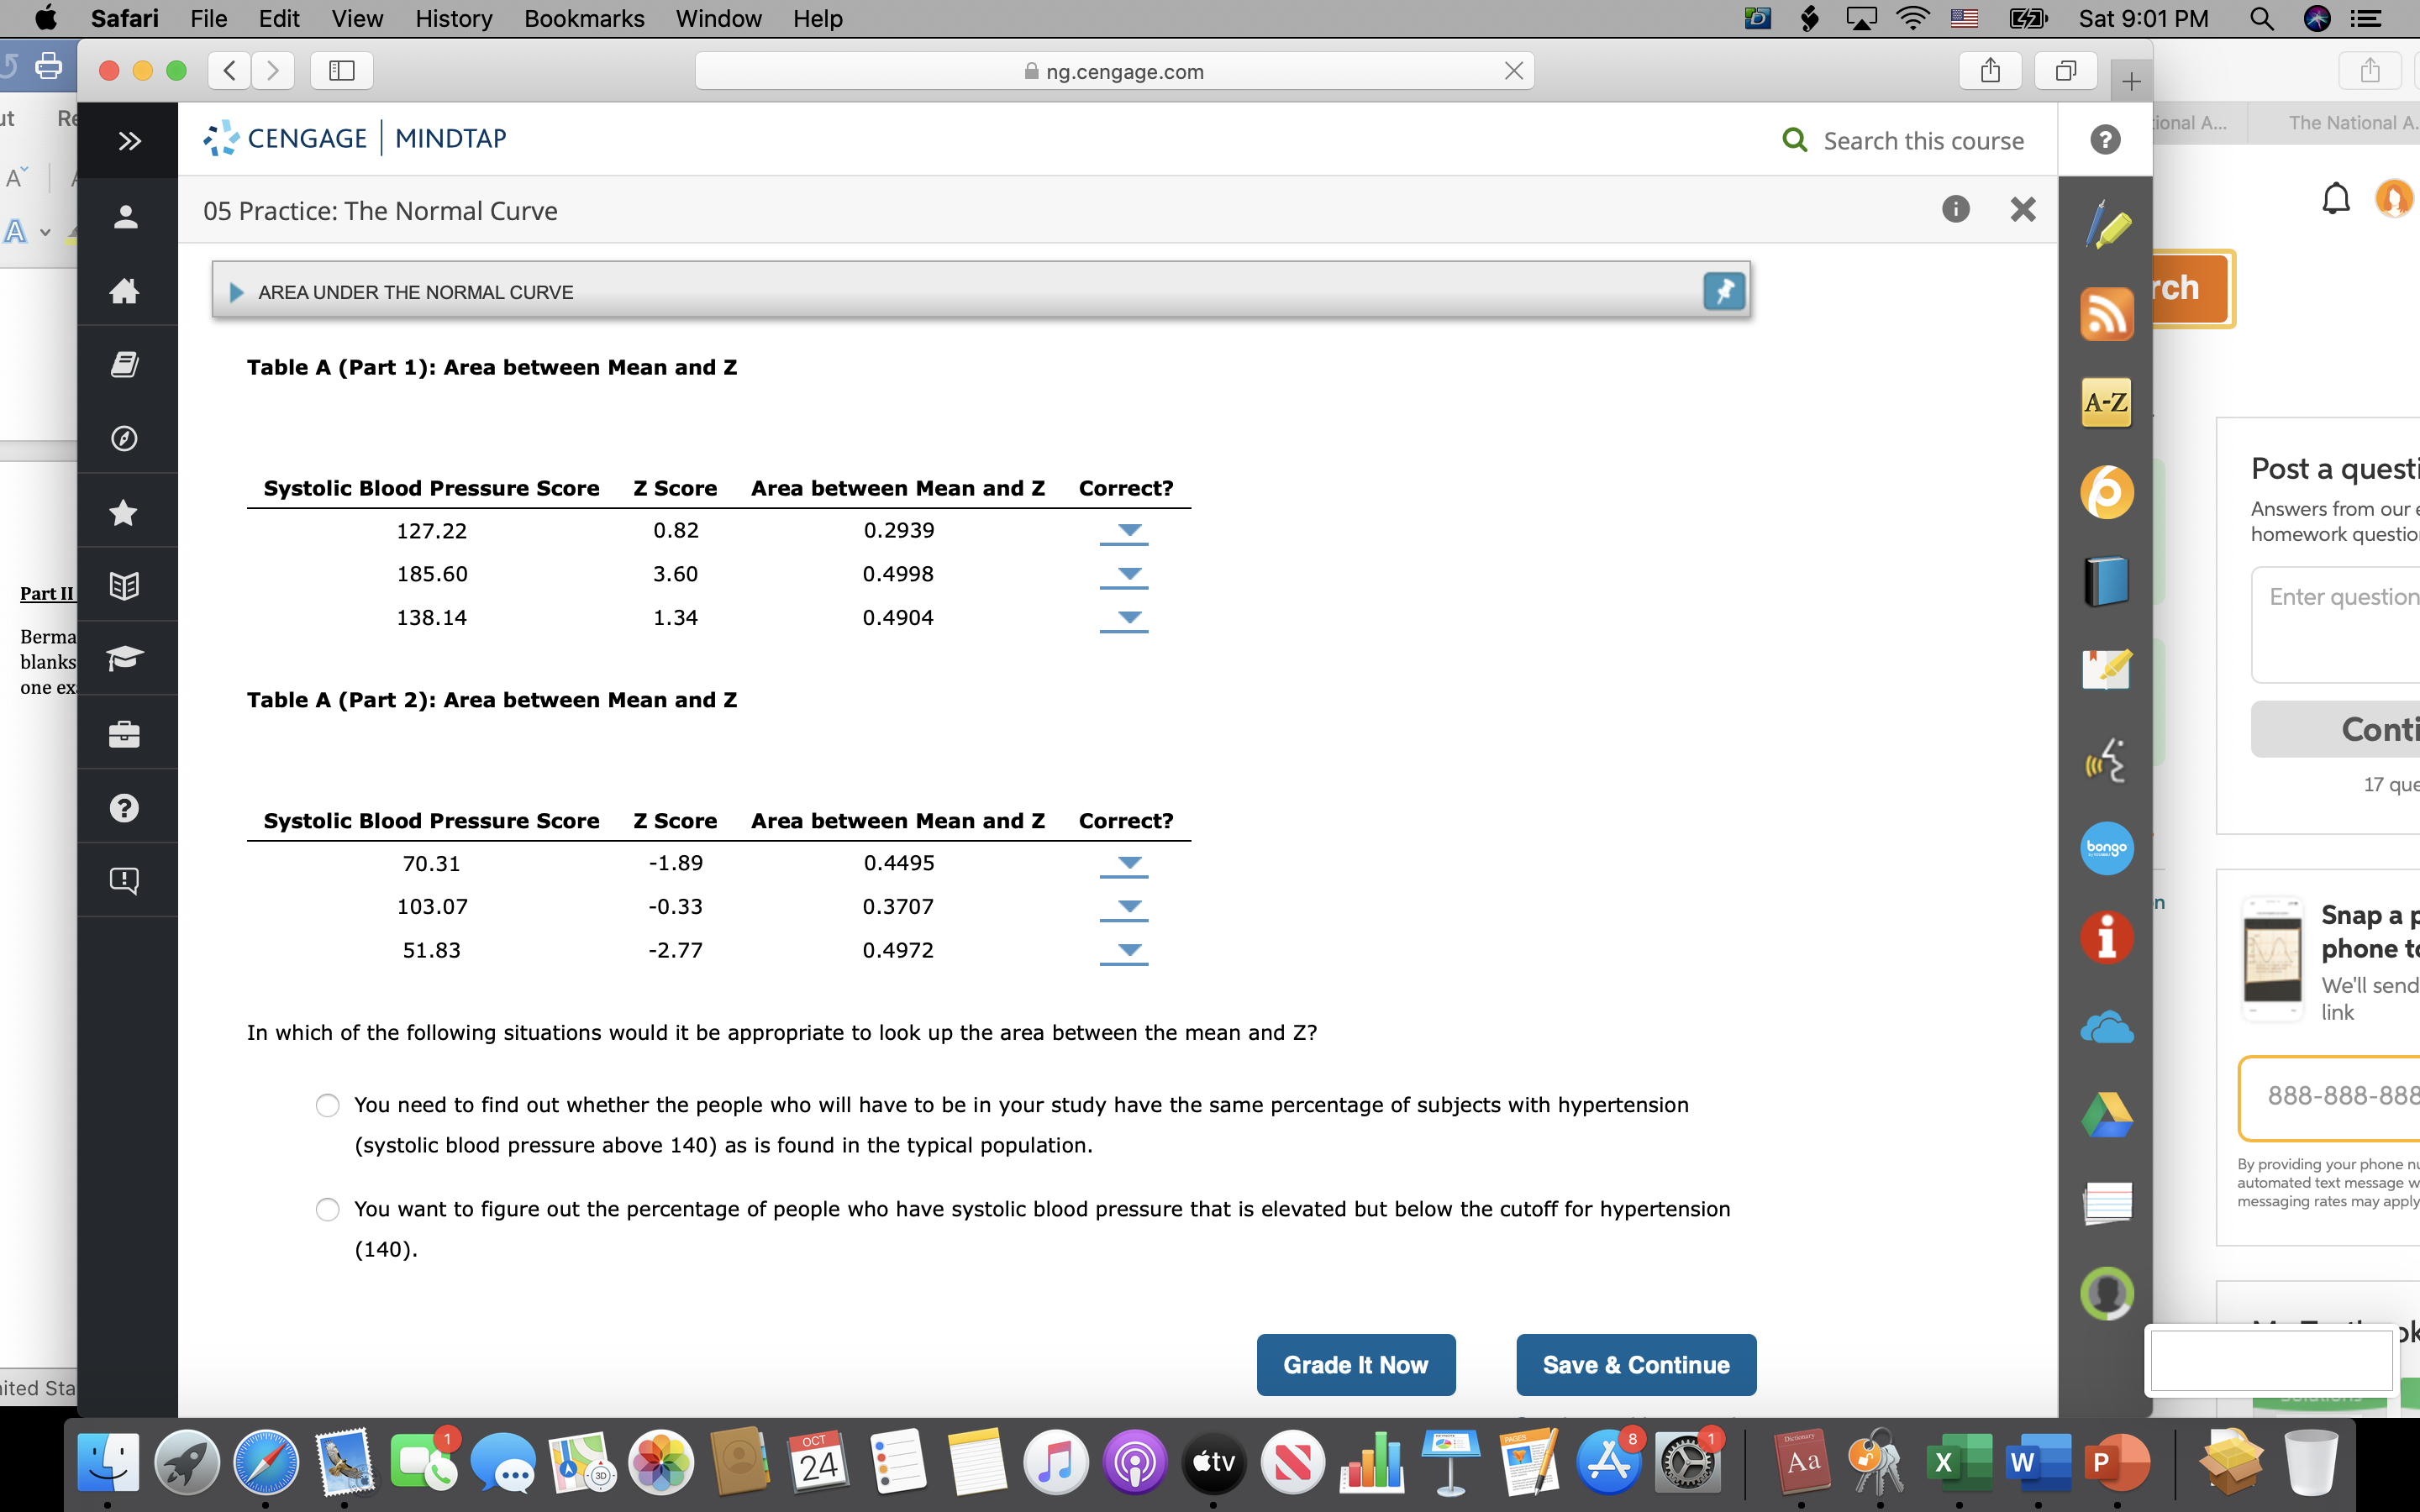
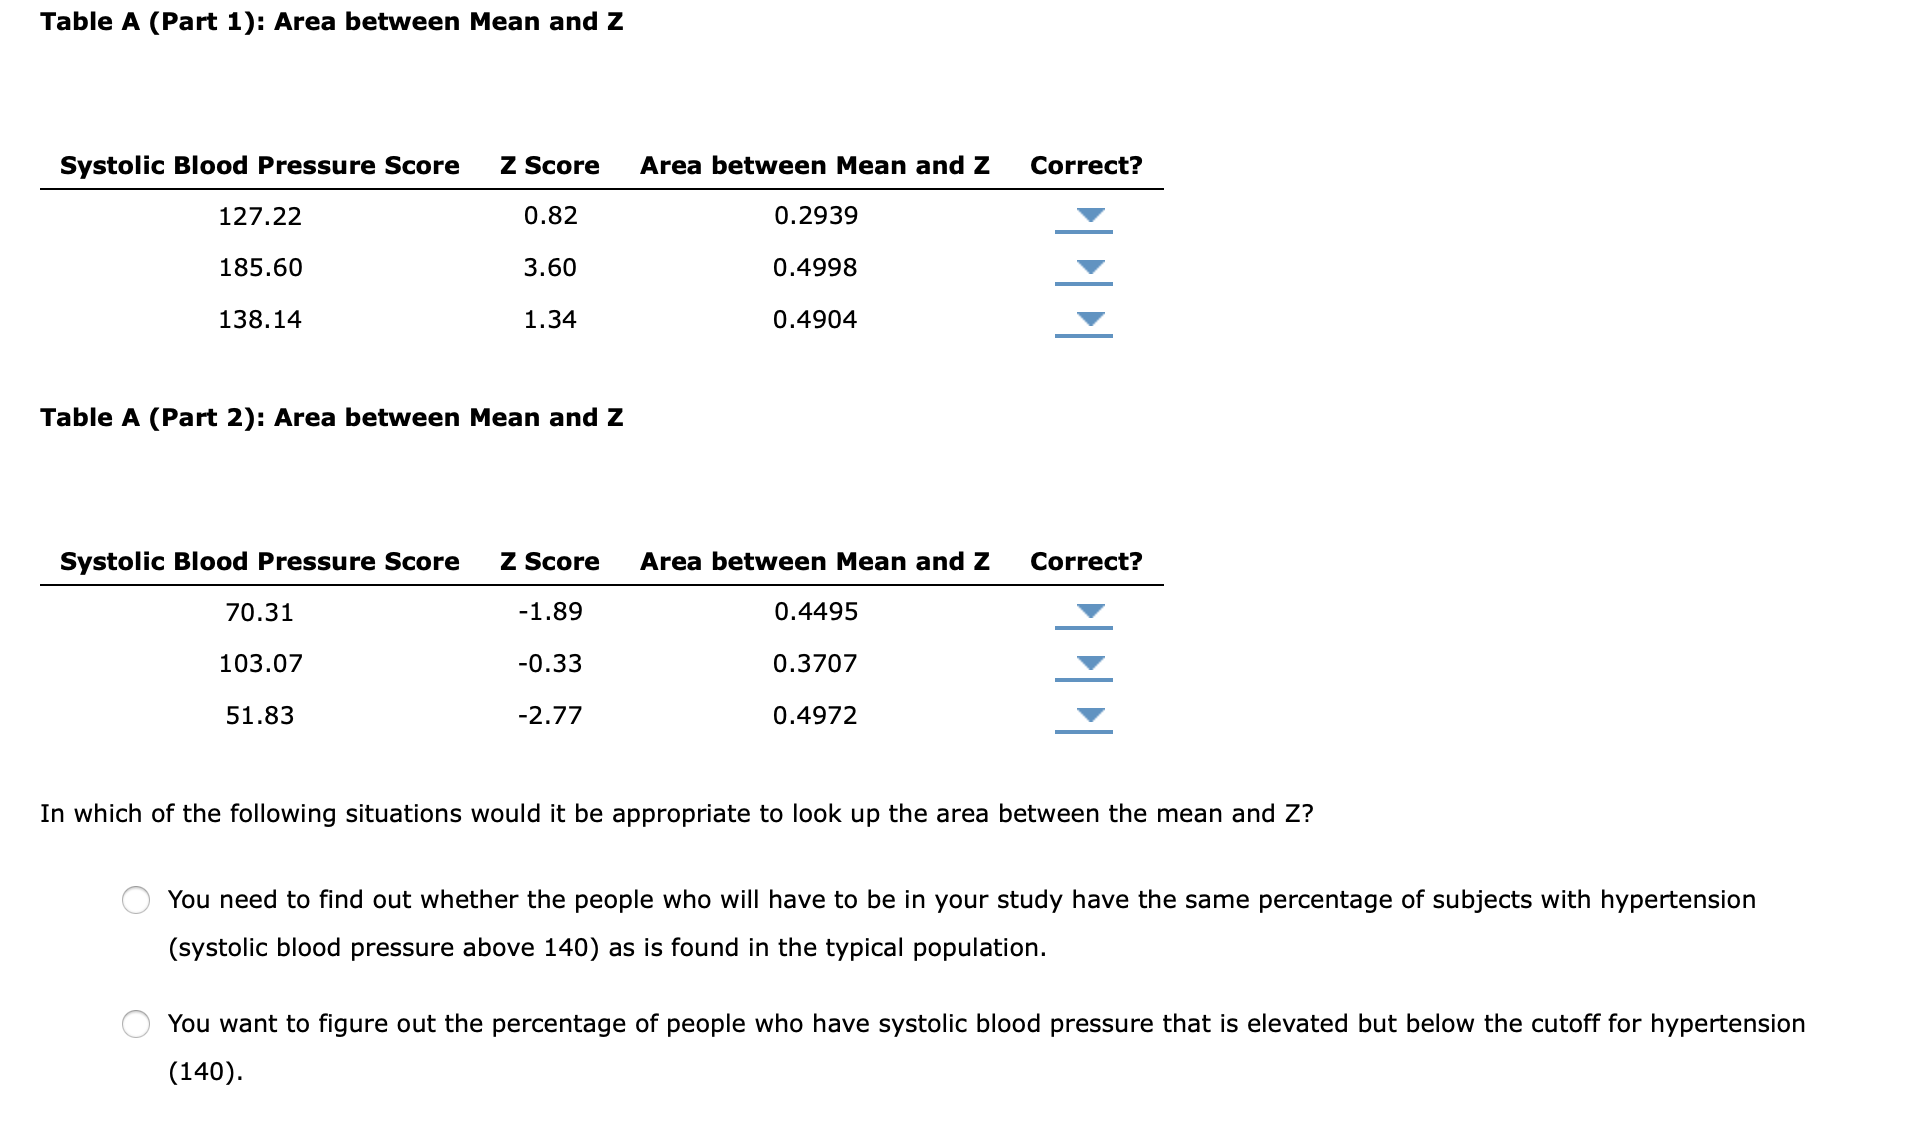
Please see screen shots and compute for Z scores. These are all one page. Thank you
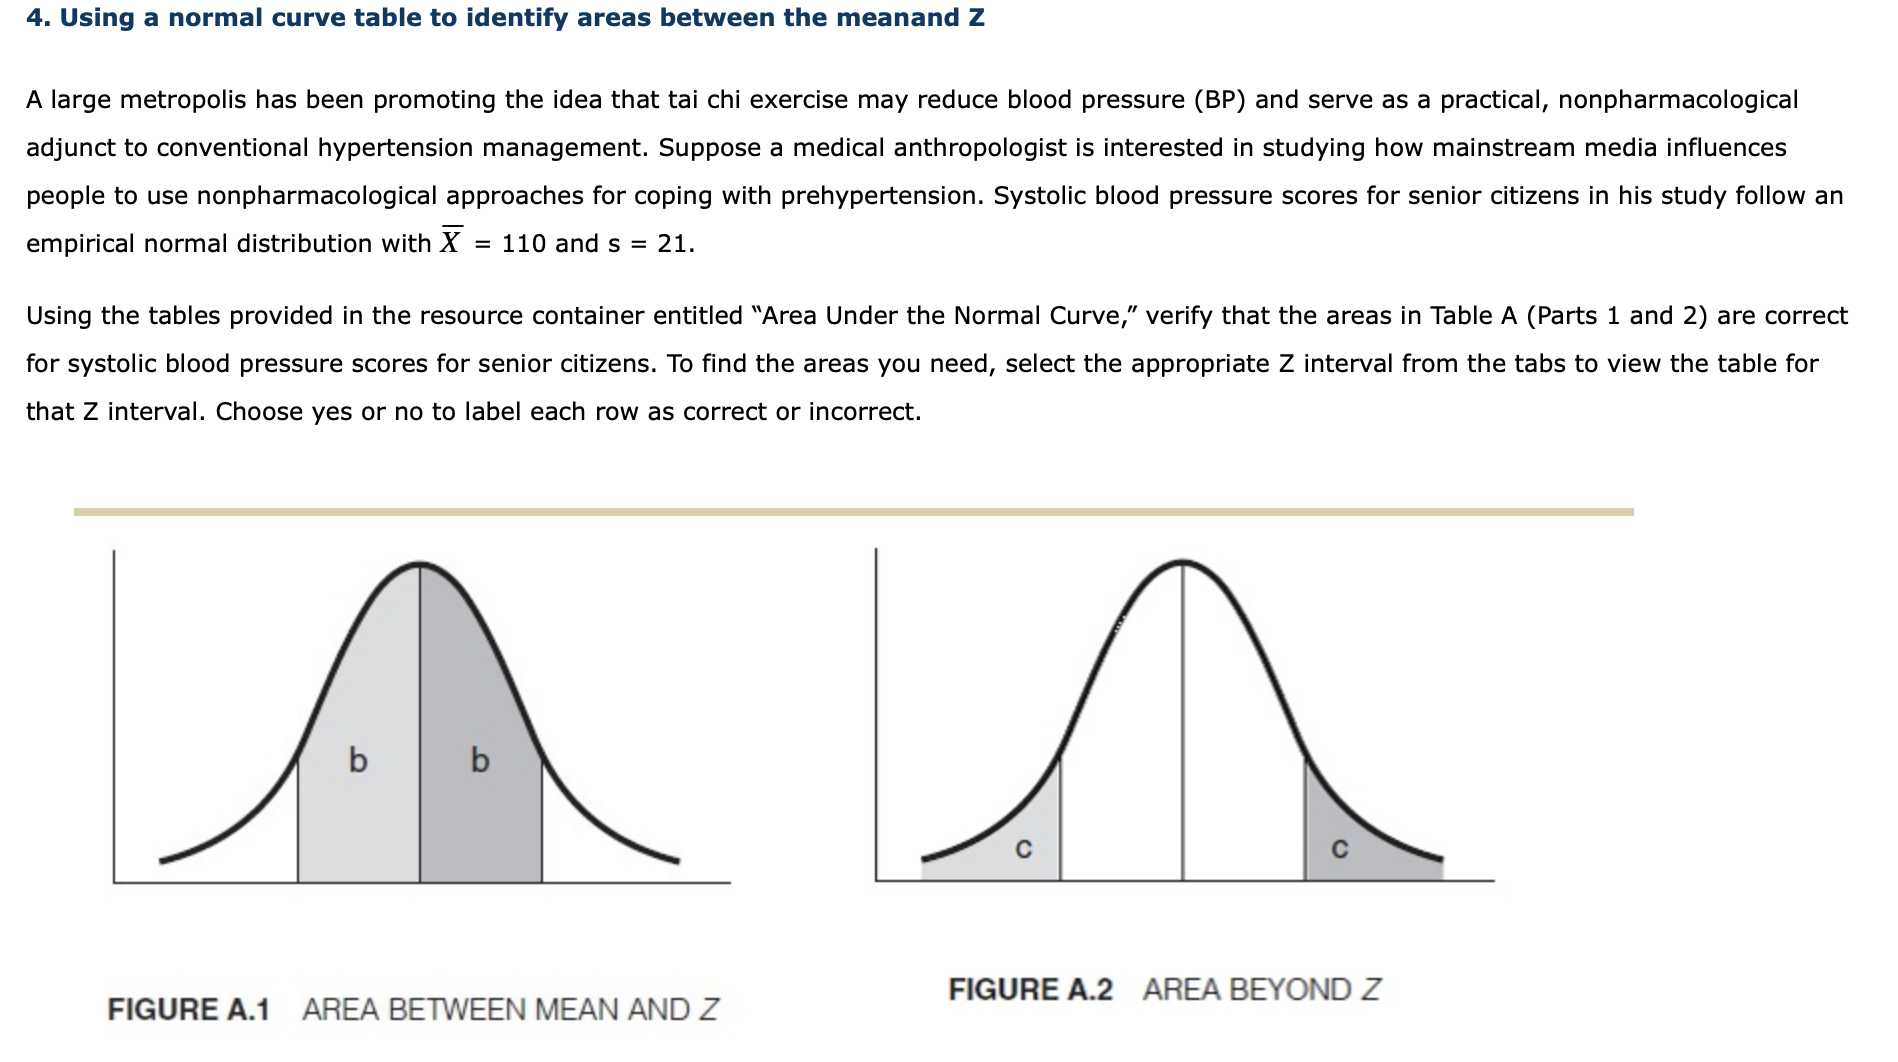
4. Using a normal curve table to identify areas between the meanand Z A large metropolis has been promoting the idea that tai chi exercise may reduce blood pressure (BP) and serve as a practical, nonpharmacological adjunct to conventional hypertension management. Suppose a medical anthropologist is interested in studying how mainstream media inuences people to use nonpharmacological approaches for coping with prehypertension. Systolic blood pressure scores for senior citizens in his study follow an empirical normal distribution with )7 = 110 and s = 21. Using the tables provided in the resource container entitled \"Area Under the Normal Curve,\" verify that the areas in Table A (Parts 1 and 2) are correct for systolic blood pressure scores for senior citizens. To nd the areas you need, select the appropriate 2 interval from the tabs to view the table for that Z interval. Choose yes or no to label each row as correct or incorrect. FIGURE A2 AREA BEYOND 2 FIGURE A.1 AREA BETWEEN MEAN AND Z ii . O . L'L' = . Hngcengagecom X. The National A. 00 >> o::CENGAGE | MINDTAP 05 Practice: The Normal Curve AREA UNDER THE NORMAL CURVE Table A (Part 1): Area between Mean and Z Post a questi Answers from oun Systolic Blood Pressure Score 2 Score Area between Mean and 2 Correct? 127.22 0.82 0.2939 V homework questio 185.60 3.60 0.4998 V Enter question 138.14 1.34 0.4904 V Table A (Part 2): Area between Mean and z 4. Conti w ( 17 qua Systolic Blood Pressure Score 2 Score Area between Mean and 2 Correct? 70.31 -1.39 0.4495 v \"w 103.07 -0.33 0.3707 V . 1 ' Snap 3F 51.83 -2.77 0.4972 v I. phone t1 We'll send link In which of the following situations would it be appropriate to look up the area between the mean and Z? "\" You need to nd out whether the people who will have to be in your study have the same percentage of subjects with hypertension 88878884388 By providing your phone m automated text message w messaging rates may apply (systolic blood pressure above 140) as is found in the typical population. '3 You want to gure out the percentage of people who have systolic blood pressure that is elevated but below the cutoff for hypertension (140). 1%o%'mliW$*im arr \\ :~..: Table A (Part 1): Area between Mean and Z Systolic Blood Pressure Score 2 Score Area between Mean and 2 Correct? 127.22 0.82 0.2939 V 185.60 3.60 0.4998 V 138.14 1.34 0.4904 V Table A (Part 2): Area between Mean and Z Systolic Blood Pressure Score 2 Score Area between Mean and 2 Correct? 70.31 -1.89 0.4495 V 103.07 -0.33 0.3707 V 51.83 -2.77 0.4972 v In which of the following situations would it be appropriate to look up the area between the mean and 2? A- You need to nd out whether the people who will have to be in your study have the same percentage of subjects with hypertension (systolic blood pressure above 140) as is found in the typical population. C,- You want to figure out the percentage of people who have systolic blood pressure that is elevated but below the cutoff for hypertension (14o)


