

Question
Please see the attached images for data and scatter plots. Also, help with the correct formula and calculations for the questions 'm, n, o, p'


Please see the attached images for data and scatter plots. Also, help with the correct formula and calculations for the questions 'm, n, o, p' would very appreciative.
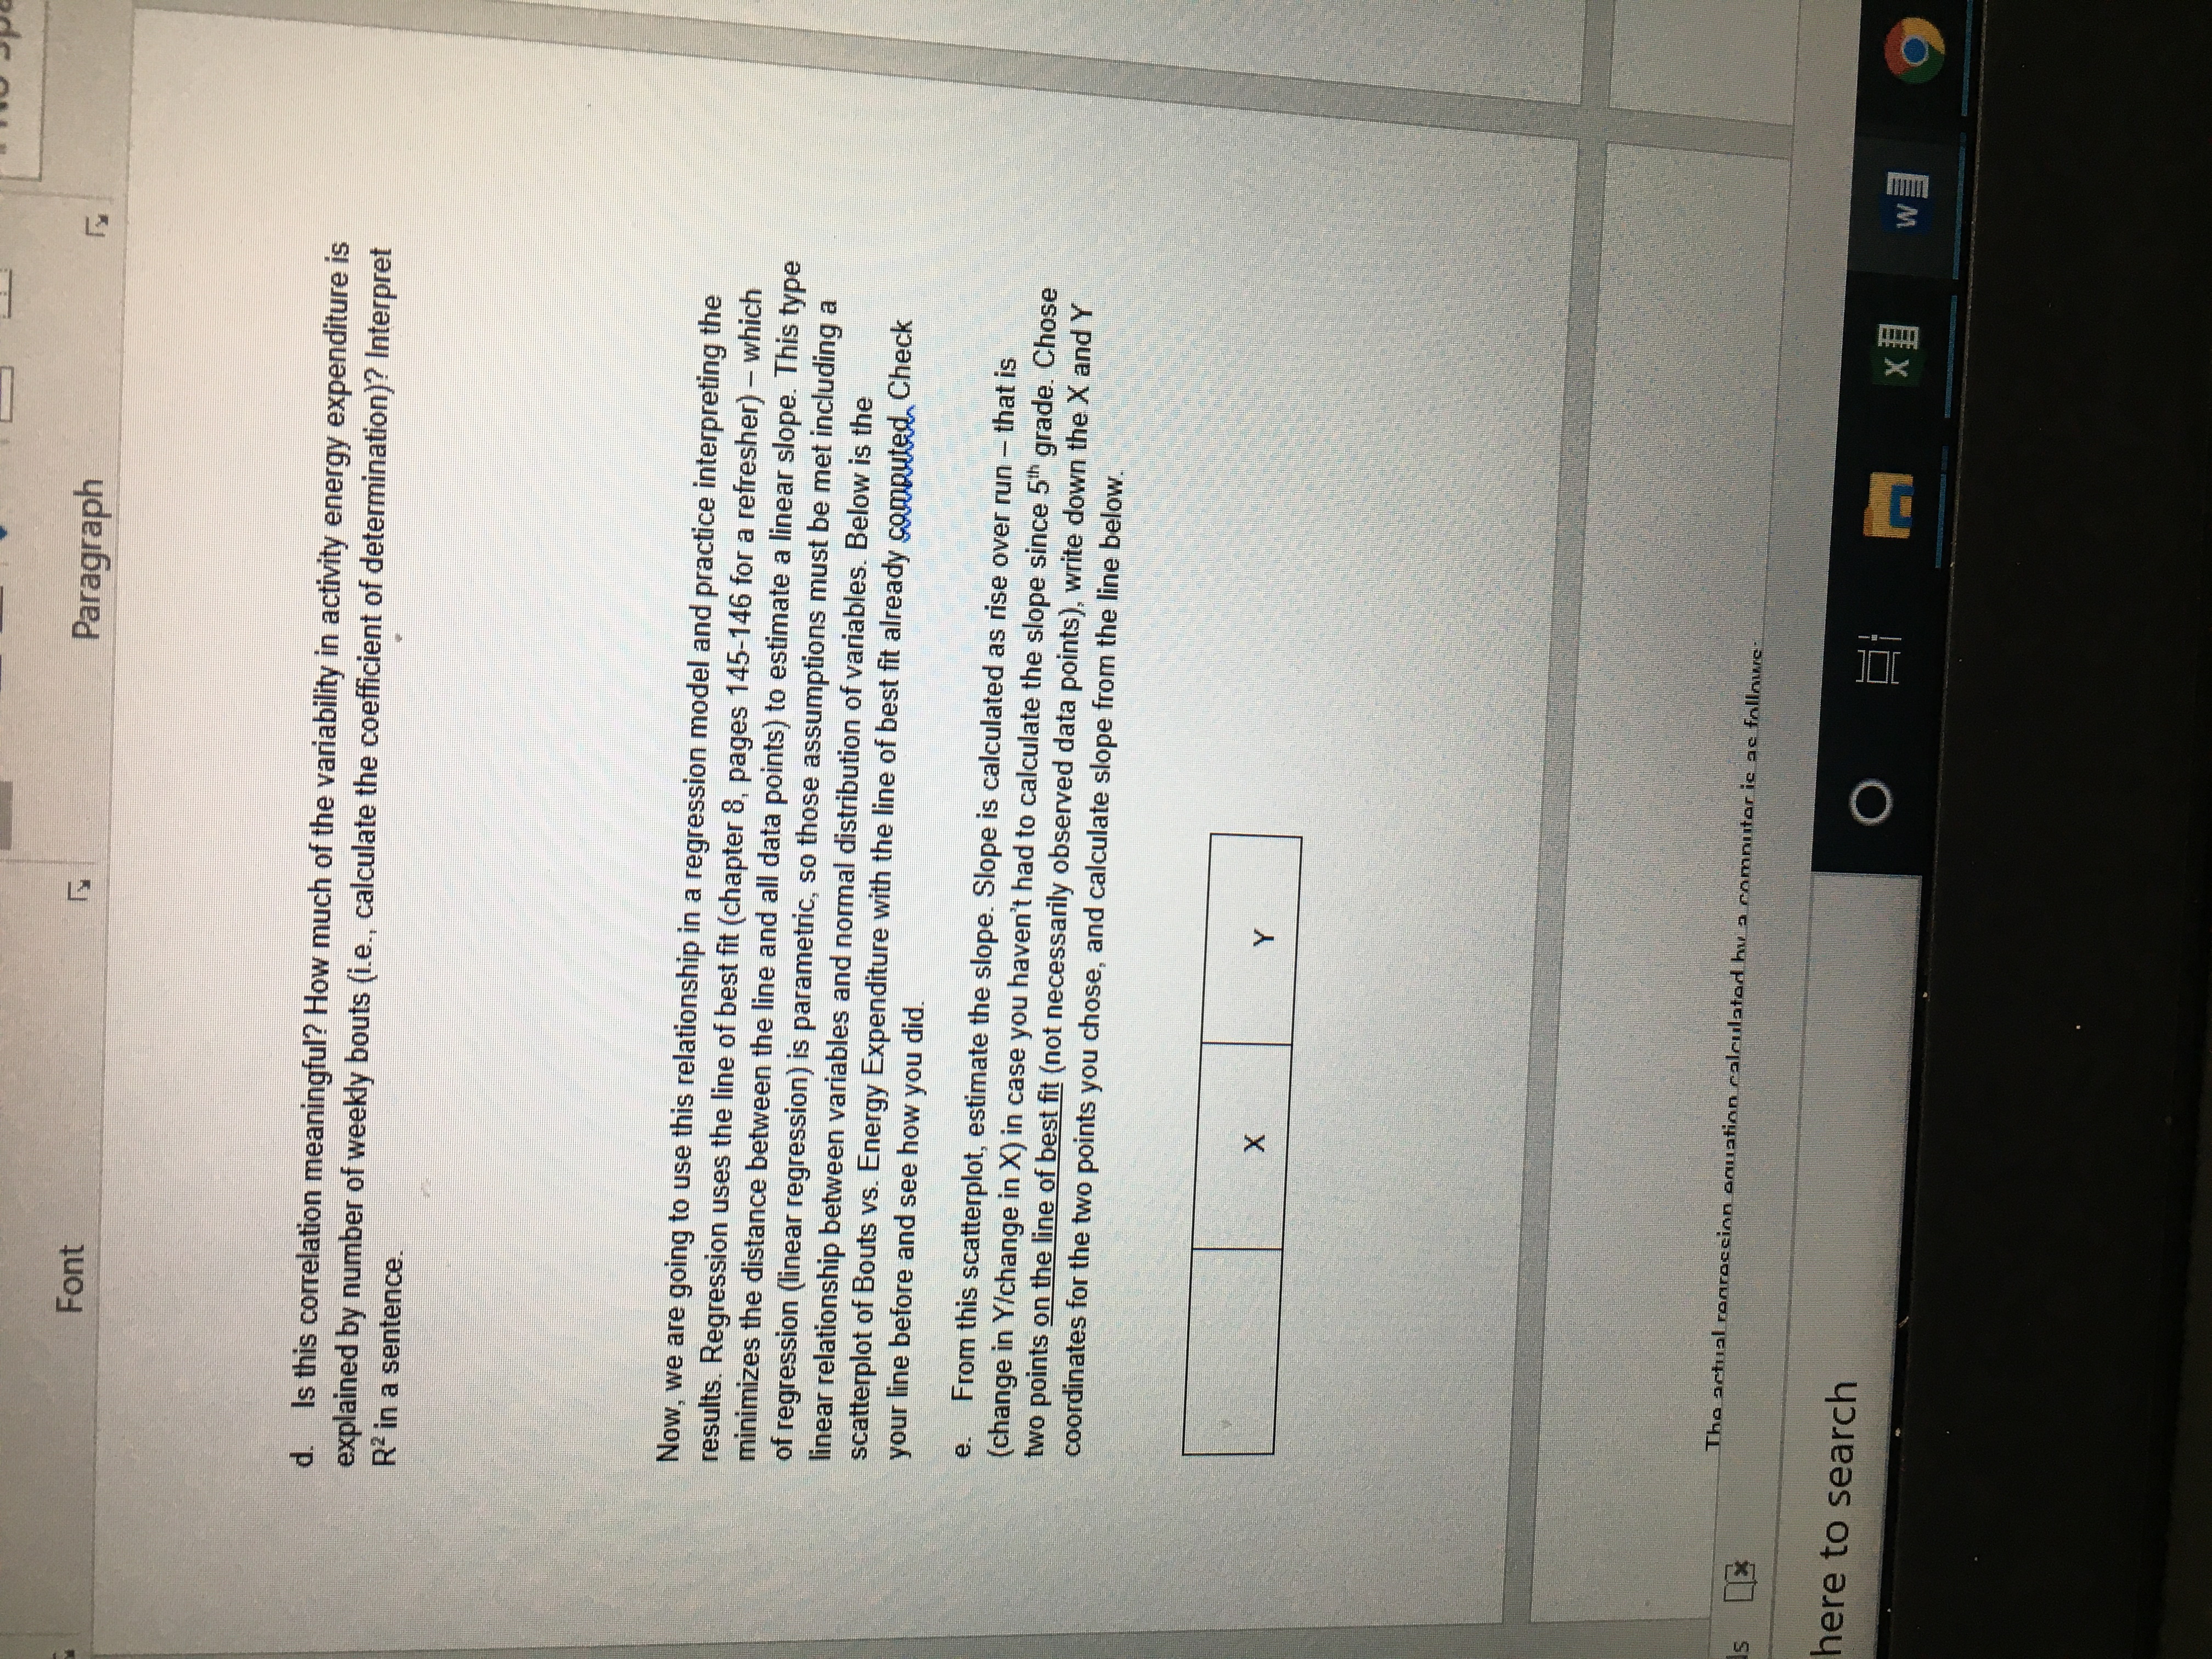
Question: d.) Is this correlation meaningful? How much of the variability in activity energy expenditure is explained by number of weekly bouts (i.e., calculate the coefficient of determination)? Please help Interpret R2 in a sentence?
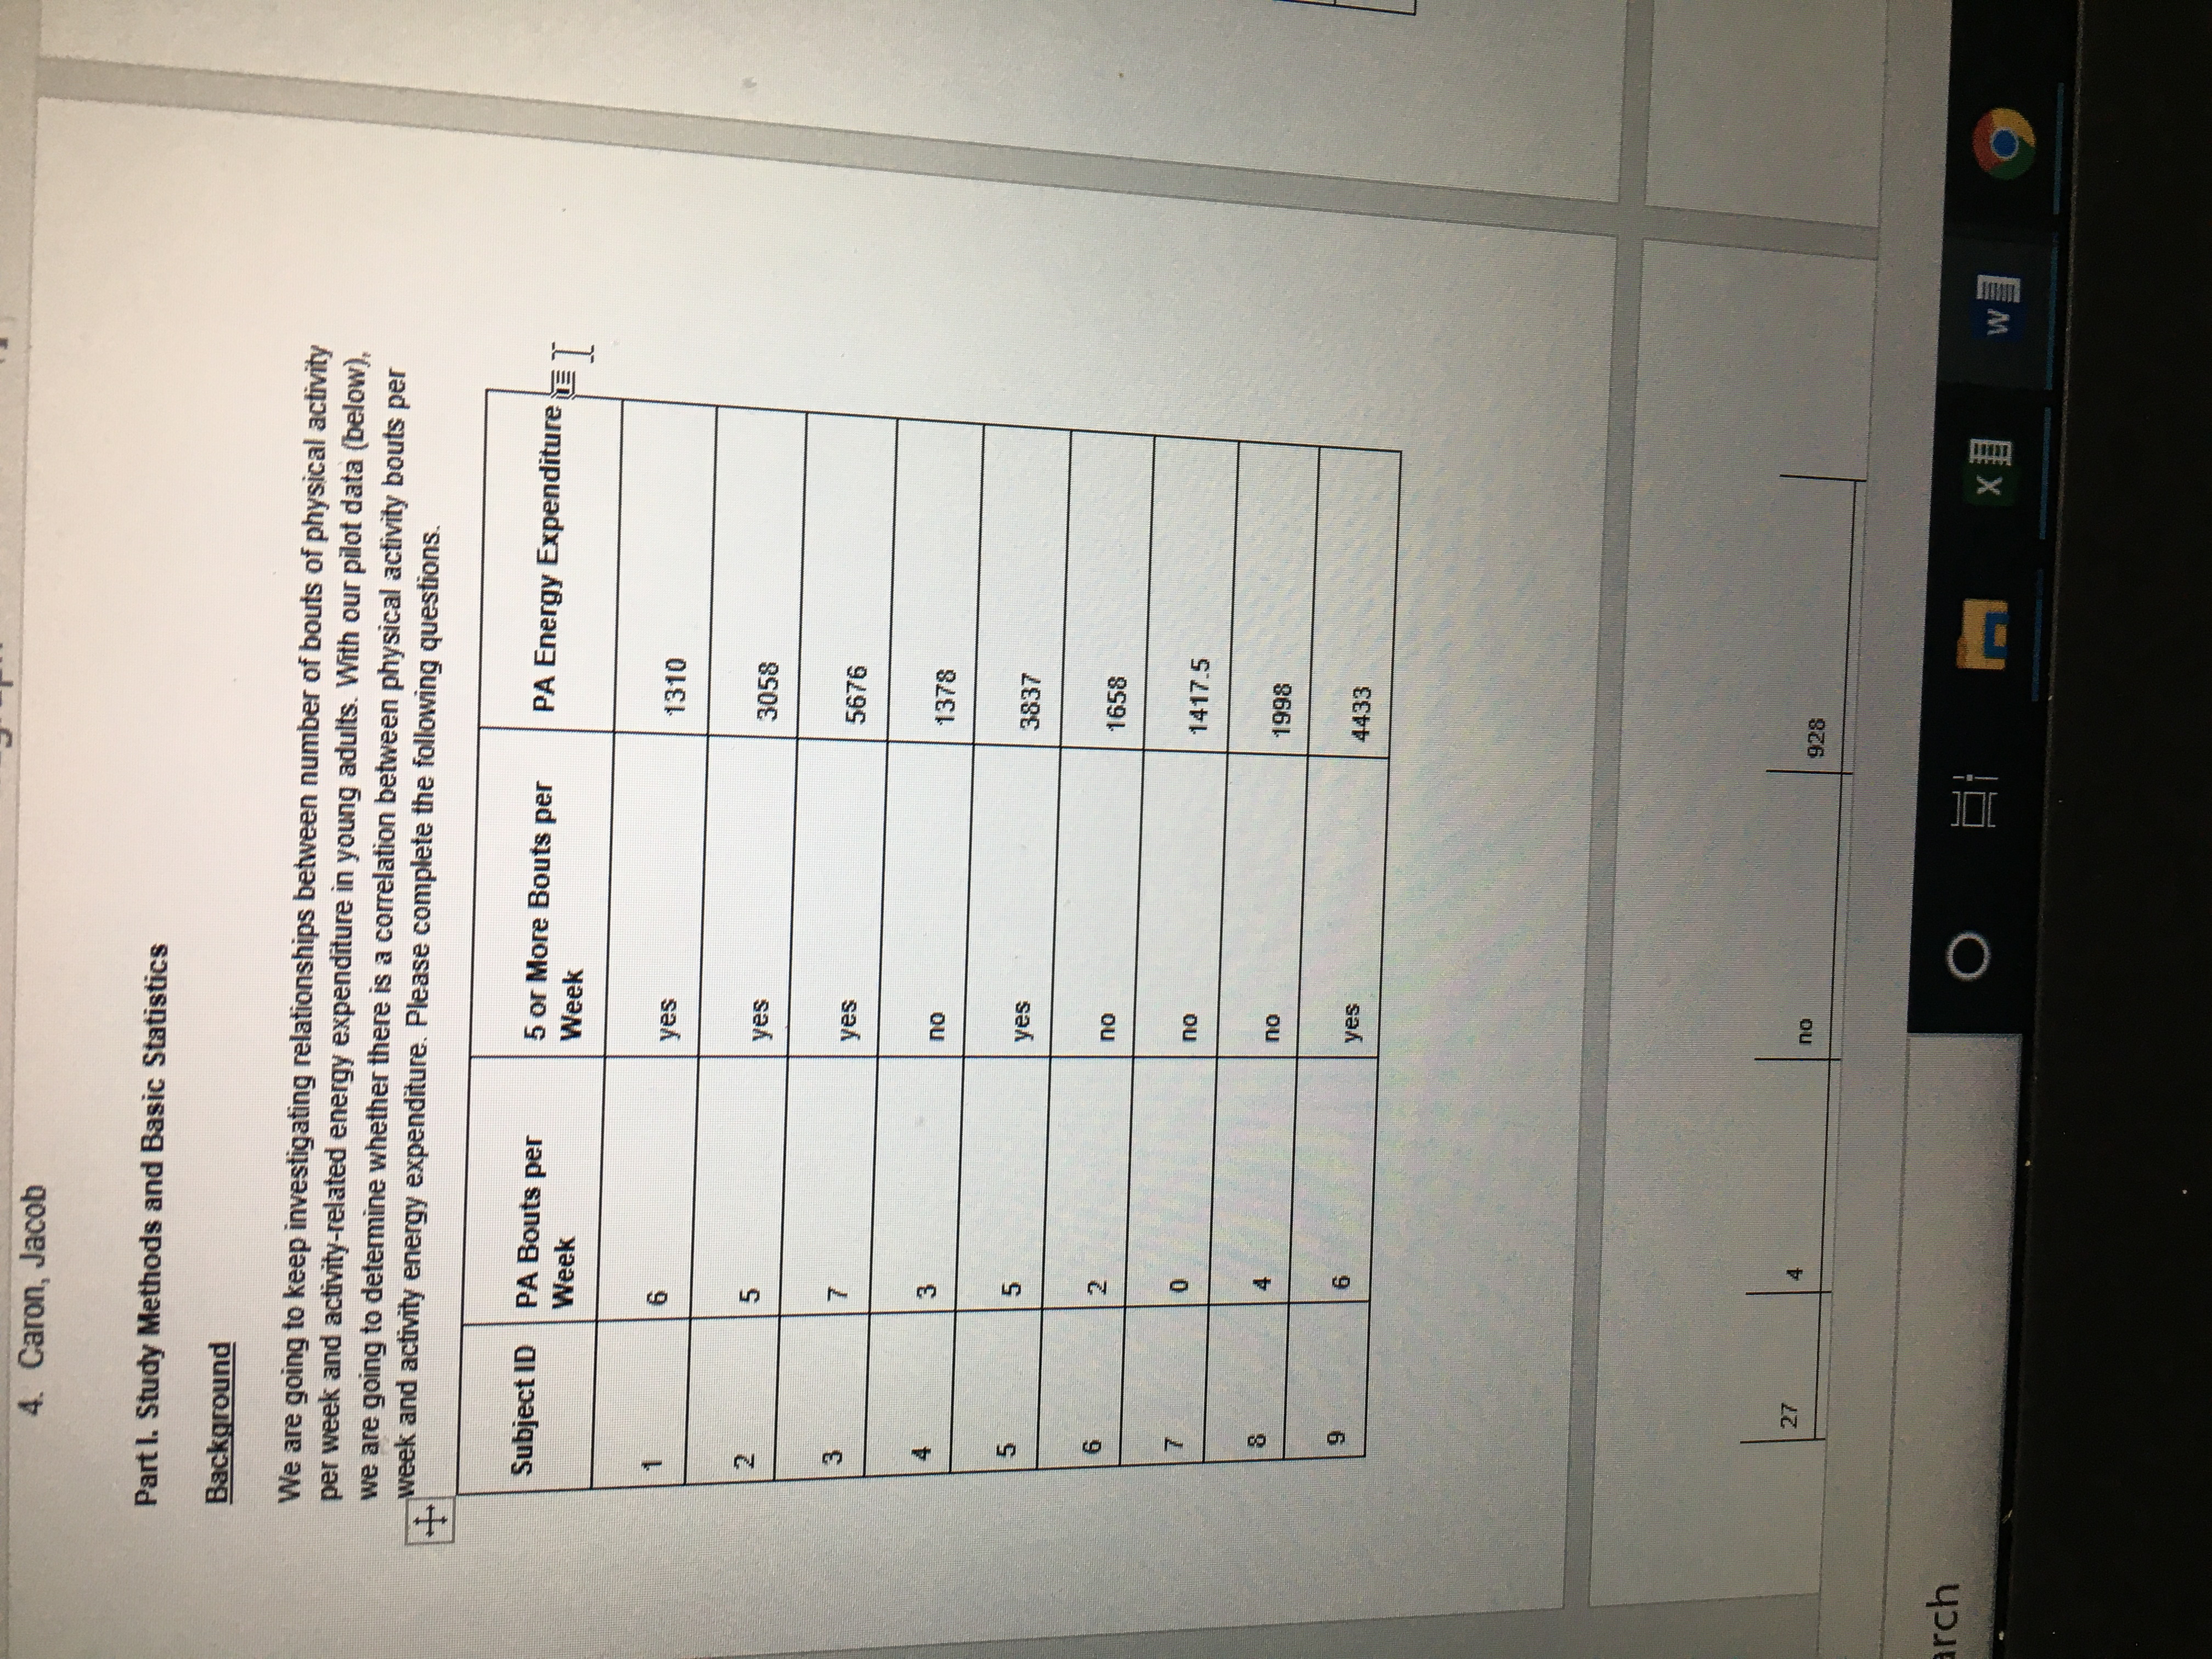
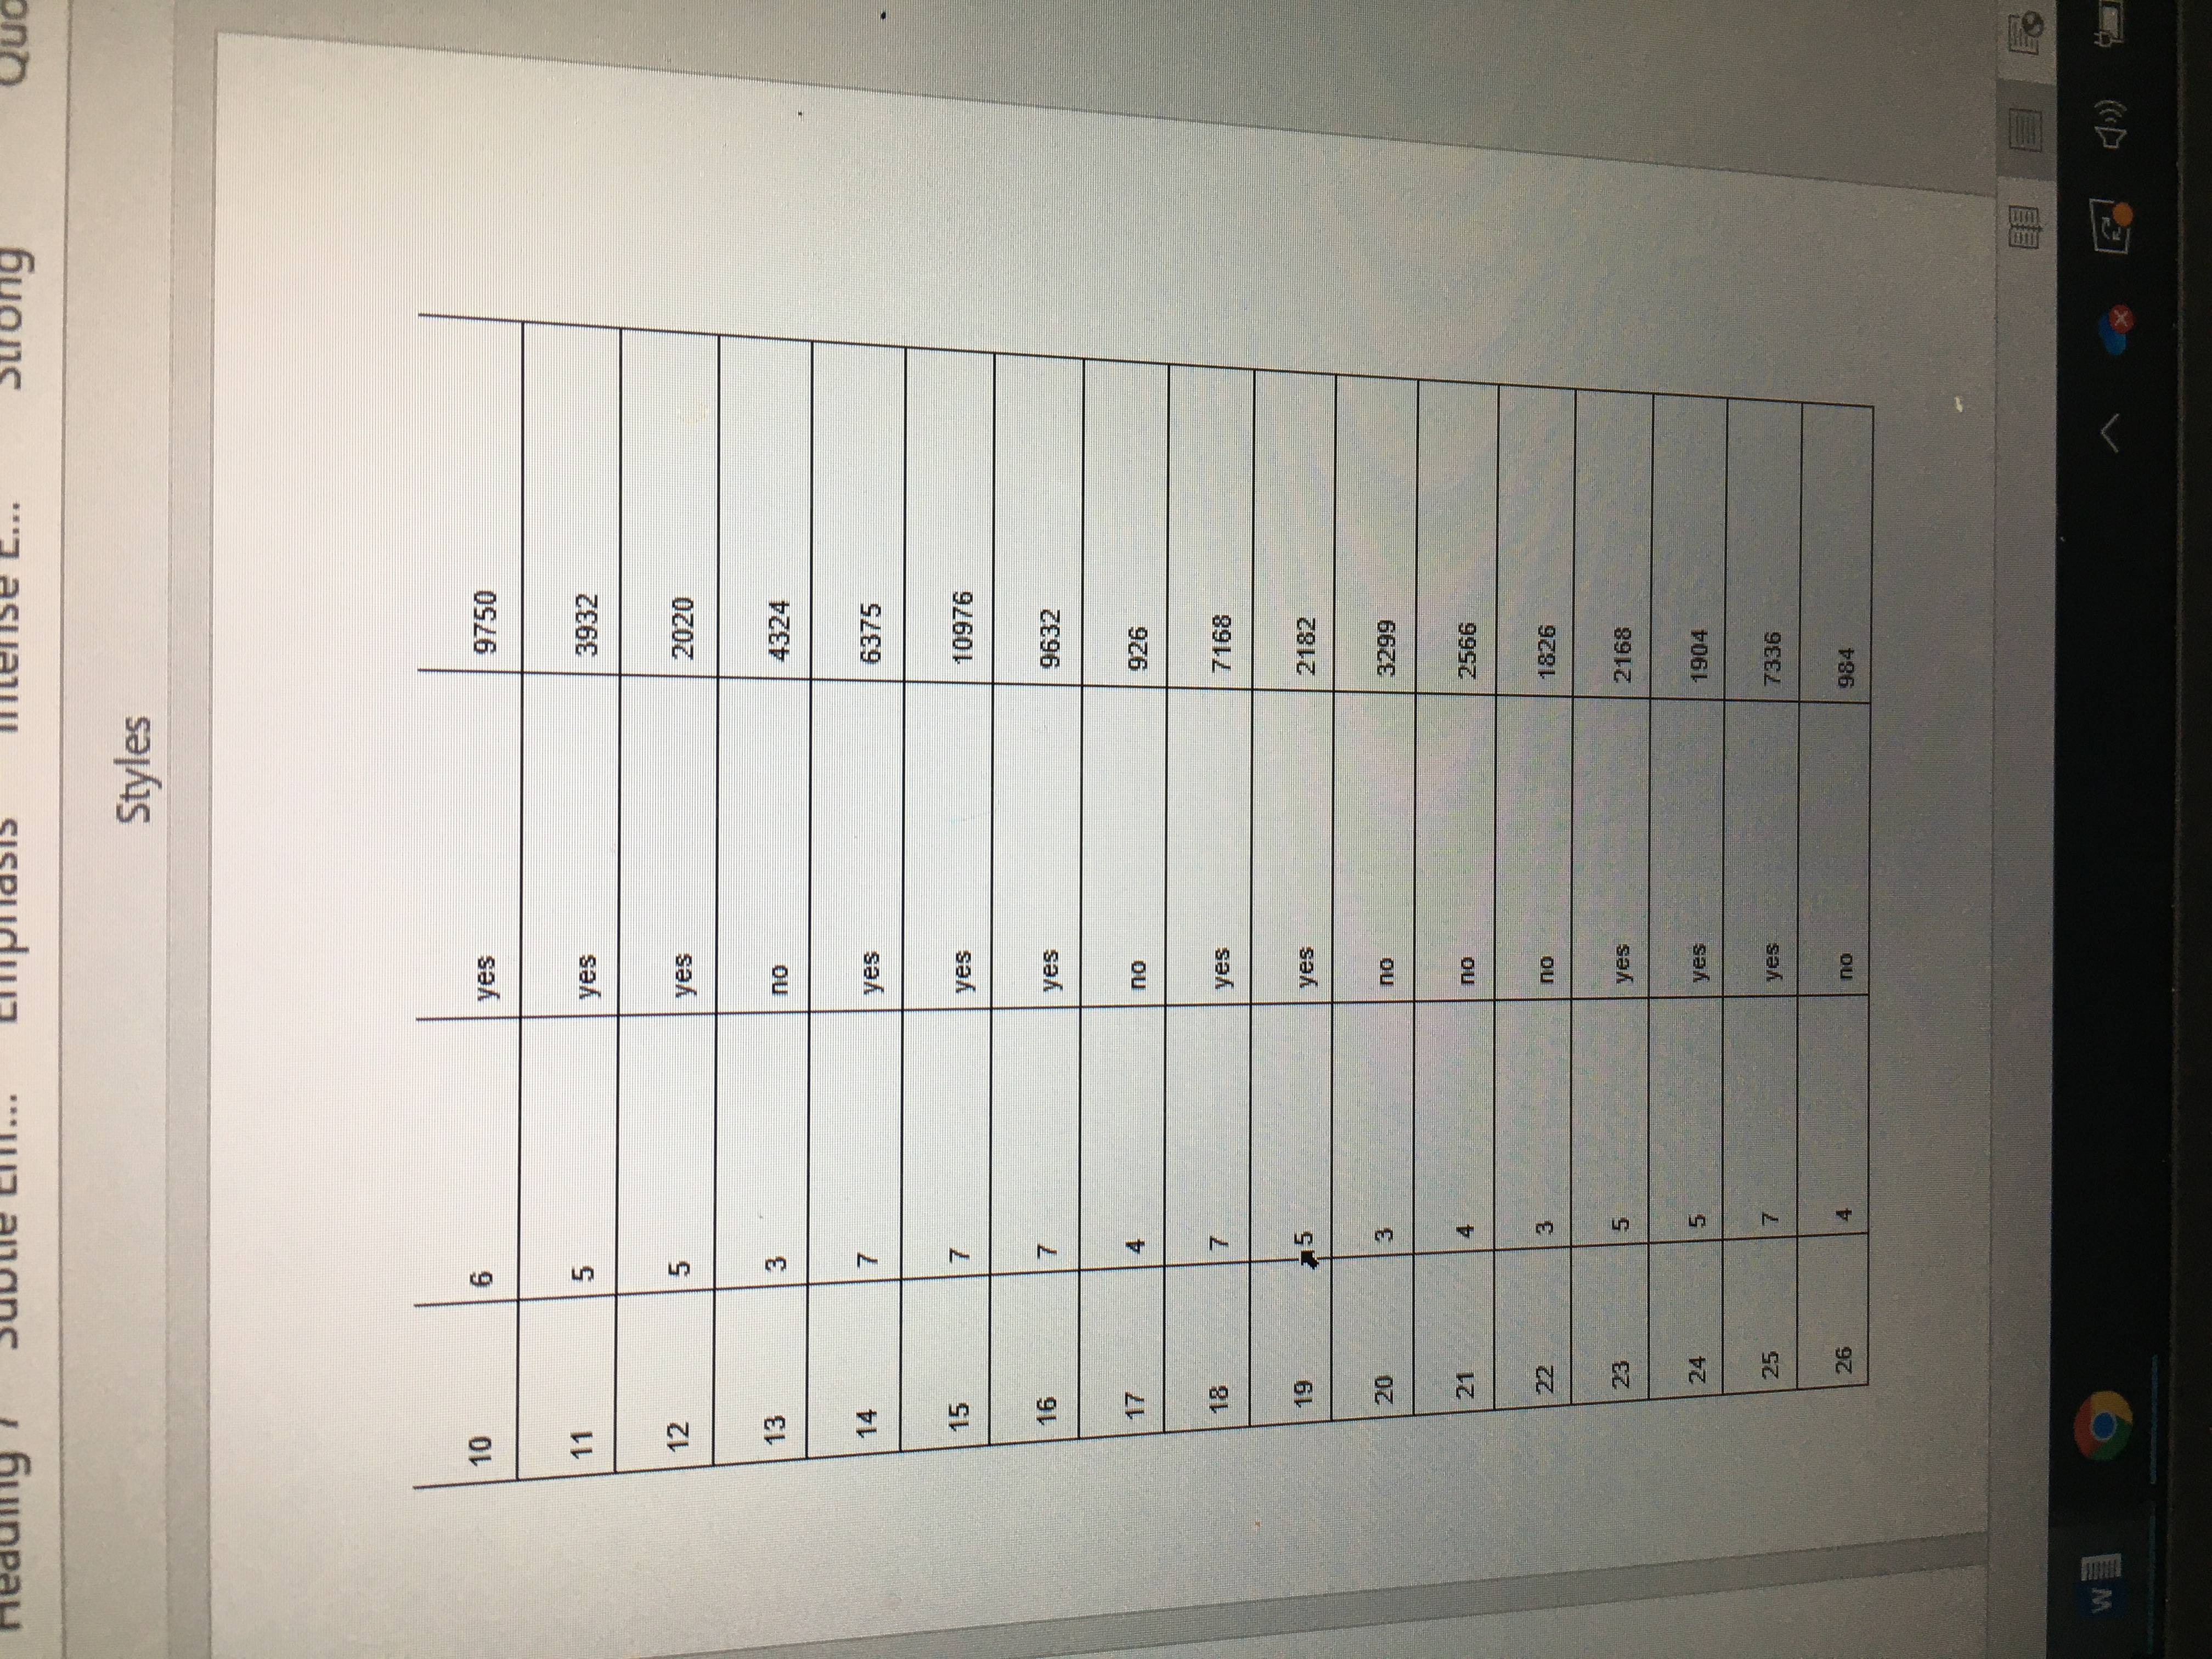
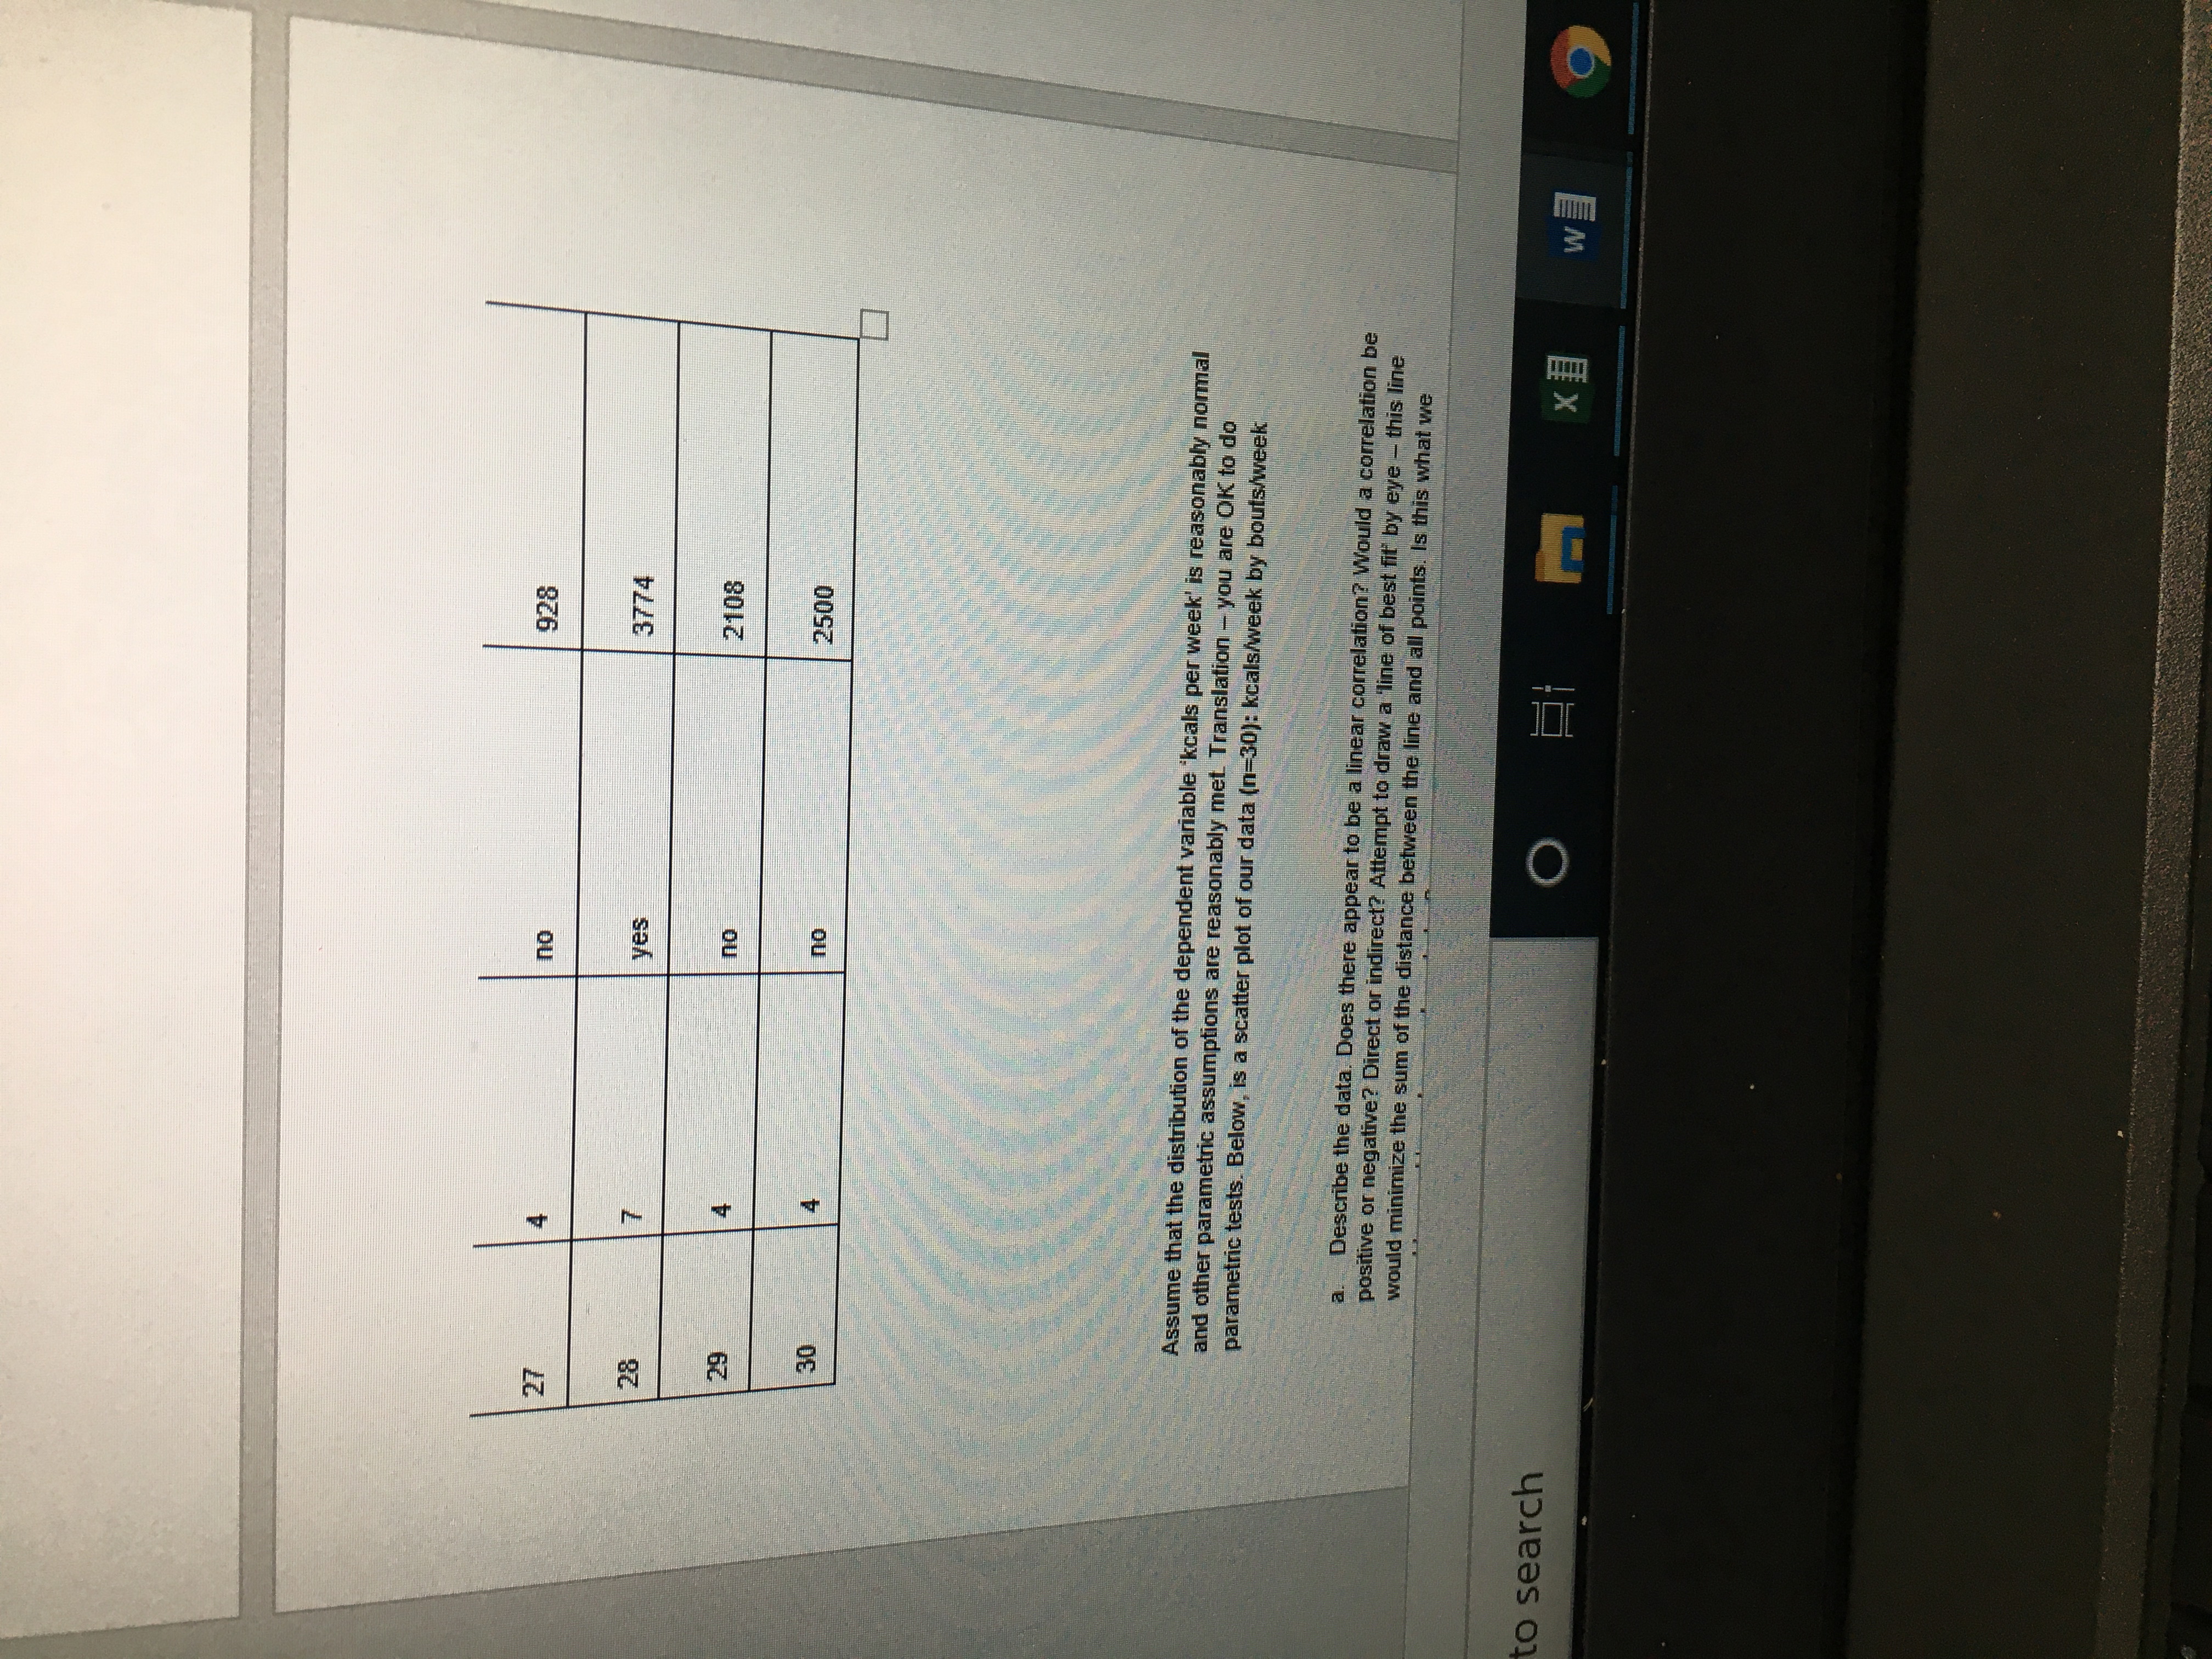
Information:
Assume that the distribution of the dependent variable 'kcals per week' is reasonably normal and other parametric assumptions are reasonably met. Translation - you are OK to do parametric tests. Below, is a scatter plot of our data (n=30): kcals/week by bouts/week
a. Describe the data. Does there appear to be a linear correlation? Would a correlation be positive or negative? Direct or indirect? Attempt to draw a 'line of best fit' by eye - this line would minimize the sum of the distance between the line and all points. Is this what we would expect based on our knowledge?
Answer: The data represented in the Physical Activity Energy Expenditure line plot represents the correlation between physical activity bouts per week and physical activity energy expenditure. The data collected from the Y (Energy Expenditure) is the dependent variable which represents what is being predicted. The data collected from the X (Bouts per Week) is the independent variable which represents the predictor. In this example, energy expenditure would be predicted from the physical bouts per week. The correlation is not perfect, because sometimes the same or less energy was spent despite the bouts per week increasing. For example, an individual that had 4 bouts per week showed less energy expenditure than an individual with 2 and 3 bouts per week. However, there does appear to be a linear correlation. As the bouts per week increased the energy expenditure mostly increased causing a positive linear correlation and direct relationship. Yes, we would expect based on our knowledge to have a line that would minimize the sum of the distance between the line and all points because the scores do not fall on a straight line. Therefore, there needs to be a calculated regression line that results in the smallest sum of squares of the vertical distance of every point from the line.
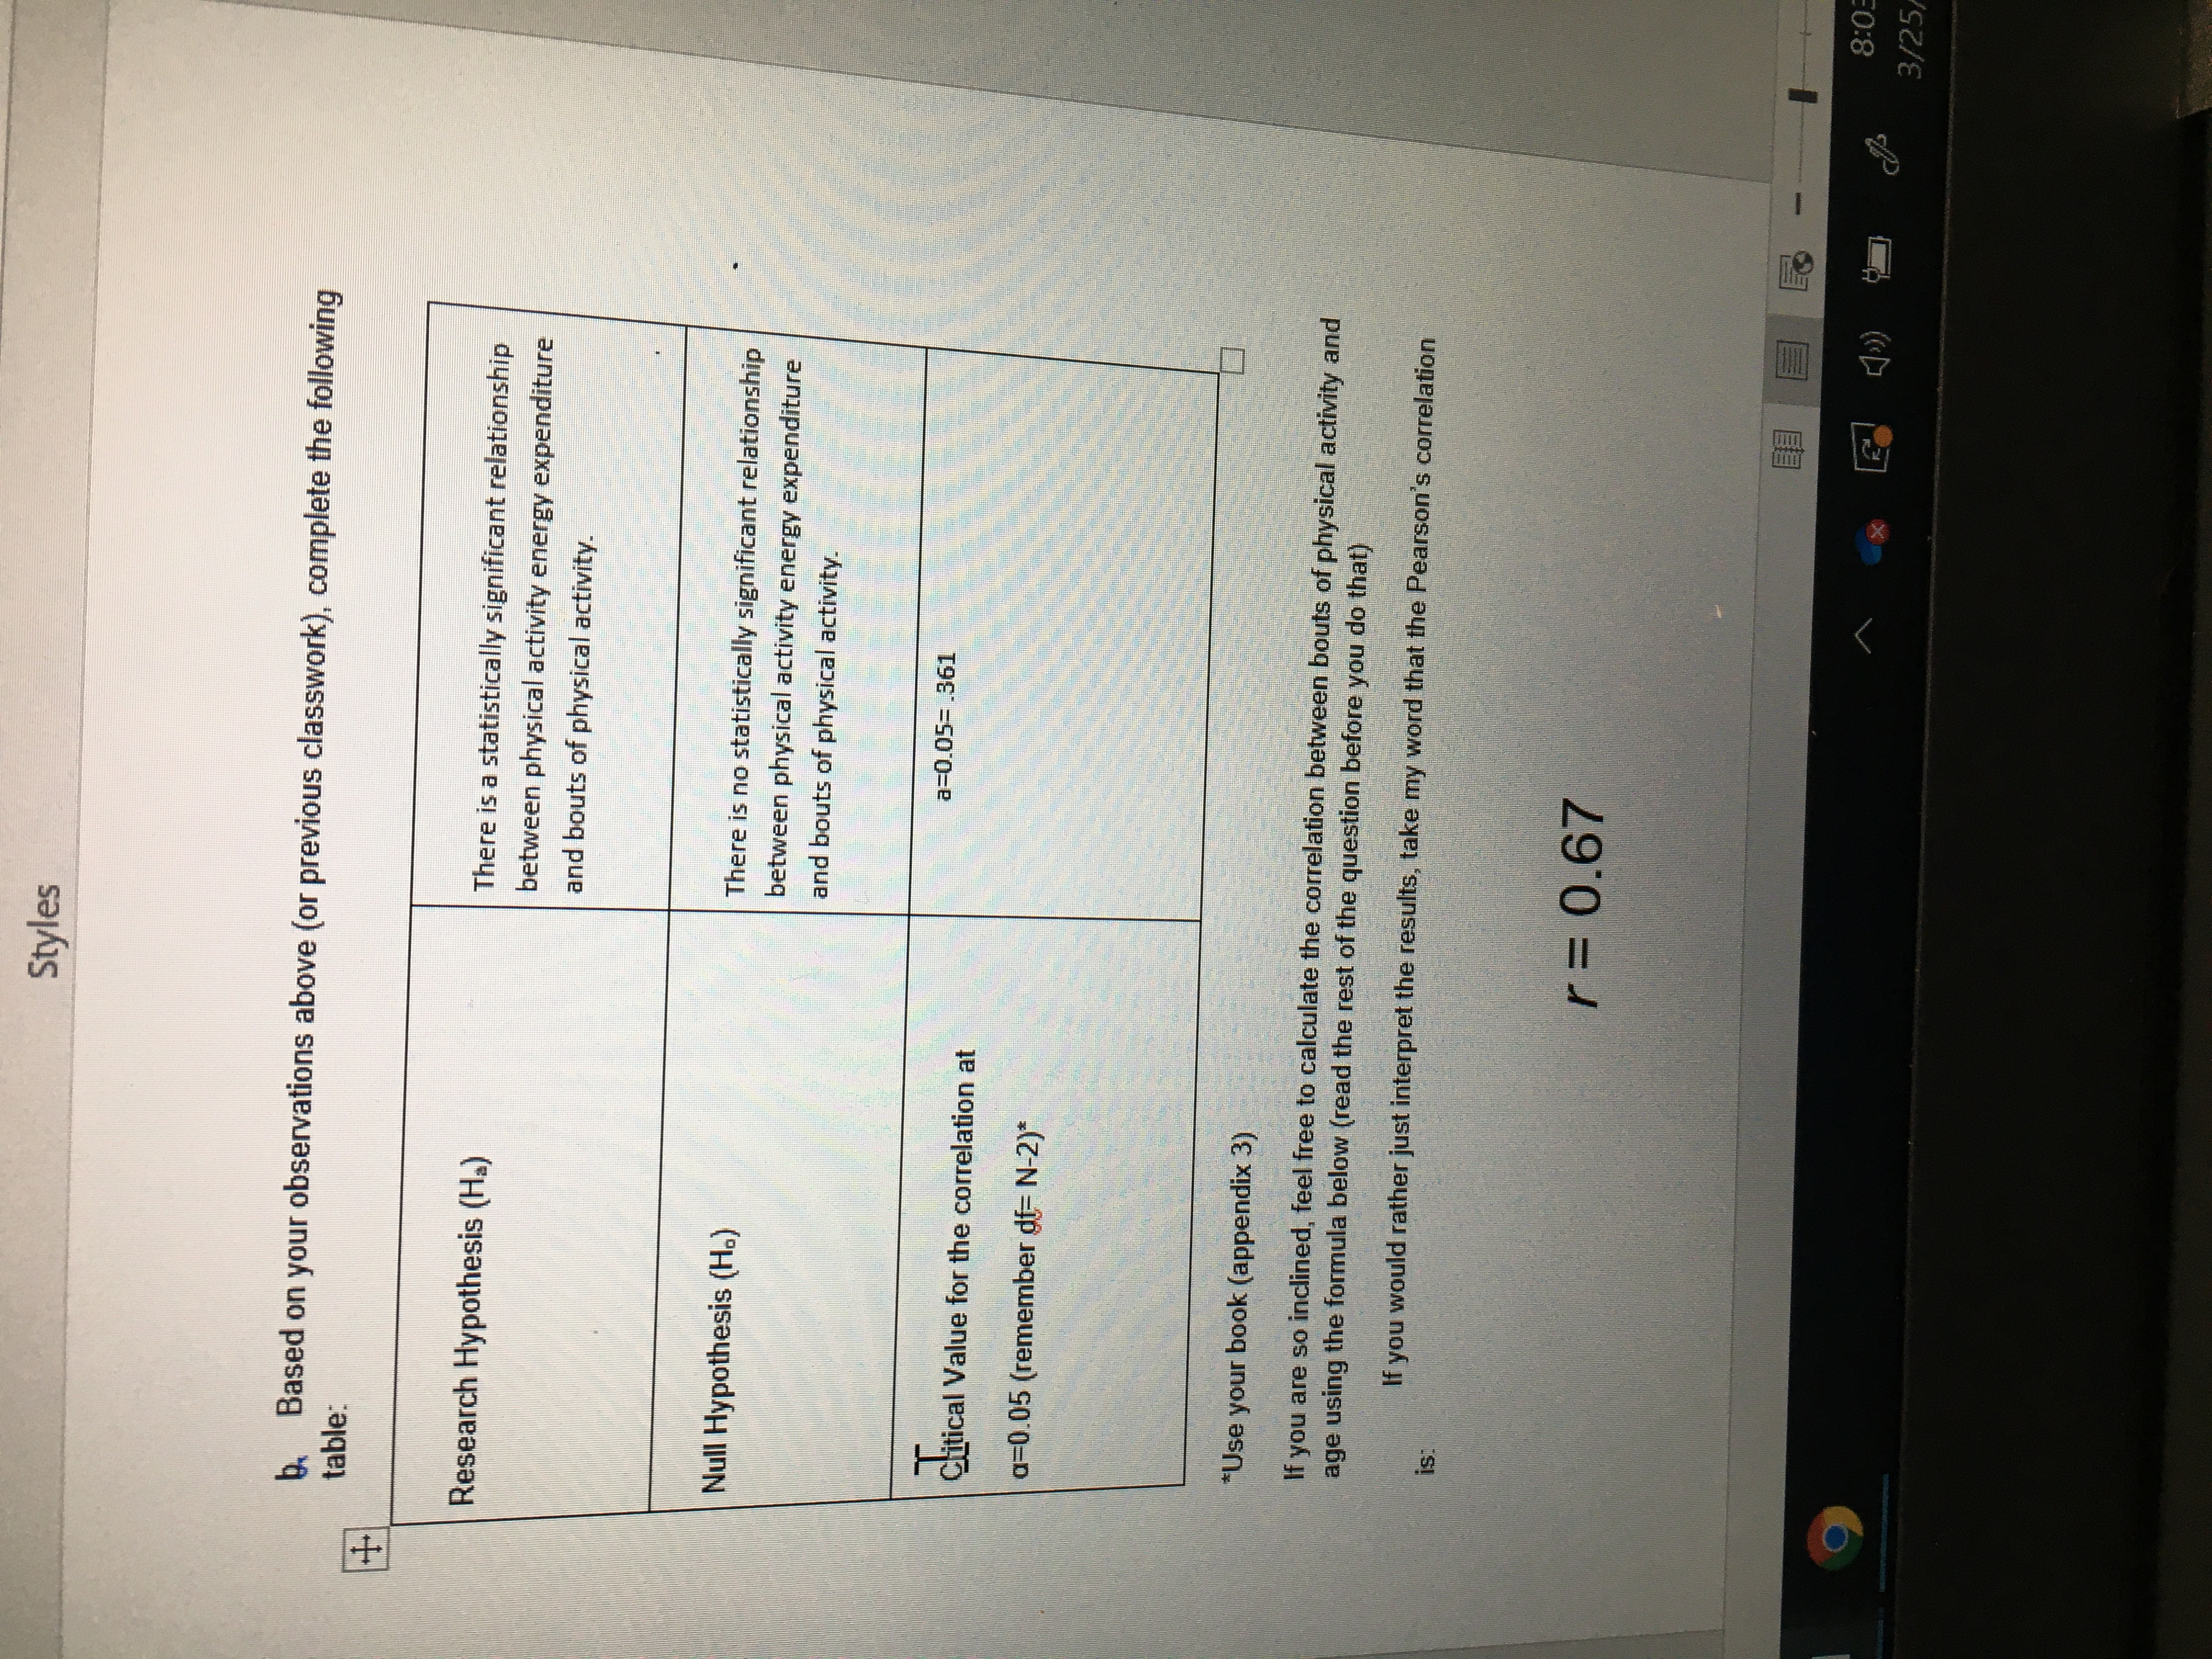
b. Based on your observations above (or previous classwork), complete the following table:
Research Hypothesis (Ha)
There is a statistically significant relationship between physical activity energy expenditure and bouts of physical activity.
Null Hypothesis (Ho)
There is no statistically significant relationship between physical activity energy expenditure and bouts of physical activity.
Critical Value for the correlation at
?=0.05 (remember df= N-2)*
a=0.05= .361
*Use your book (appendix 3)
If you are so inclined, feel free to calculate the correlation between bouts of physical activity and age using the formula below (read the rest of the question before you do that)
If you would rather just interpret the results, take my word that the Pearson's correlation is:
r = 0.67
c. Based on the critical value you determined above, is this correlation statistically significant with a 2-sided ? of 0.05? Go back to the table in the book and compare the r above to the critical value. Remember - you want the correlation you find to be at least that of the critical value.
Answer: When reading the table at 28 df, we see that a correlation of .361 is necessary for significance of a two-tailed test at the .05 level. Therefore, we would have to conclude that the Pearson's correlation of r= 0.67 is significant at p<.01>

Step by Step Solution
There are 3 Steps involved in it
Step: 1

Get Instant Access to Expert-Tailored Solutions
See step-by-step solutions with expert insights and AI powered tools for academic success
Step: 2

Step: 3
Ace Your Homework with AI
Get the answers you need in no time with our AI-driven, step-by-step assistance
Get Started
Ordinary Differential Equations
Authors: William A Adkins, Mark G Davidson
1st Edition
1461436184, 9781461436188