

Answered step by step
Verified Expert Solution
Question
1 Approved Answer
Please show all excel formulas / functions to complete the problem. Stock A and Stock B prices and dividends, along with the Market Index, are
Please show all excel formulas / functions to complete the problem.
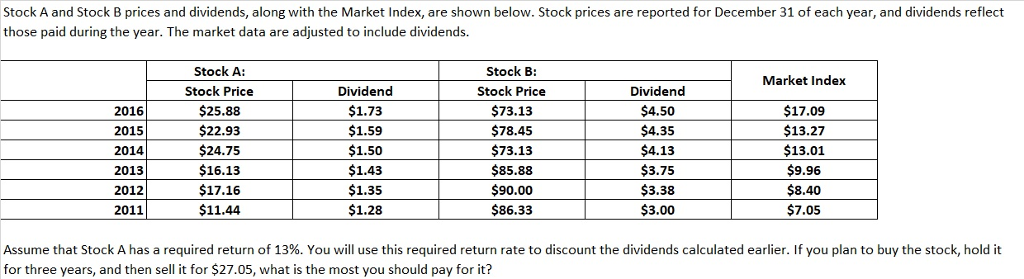
Stock A and Stock B prices and dividends, along with the Market Index, are shown below. Stock prices are reported for December 31 of each year, and dividends reflect those paid during the year. The market data are adjusted to include dividends. Stock A: Stock Price $25.88 $22.93 $24.75 $16.13 $17.16 $11.44 Stock B: Stock Price $73.13 $78.45 $73.13 $85.88 90.00 $86.33 Market Index 2016 2015 2014 2013 2012 2011 Dividend $1.73 $1.59 $1.50 $1.43 $1.35 $1.28 Dividend $4.50 $4.35 $4.13 $3.75 $3.38 $3.00 $17.09 $13.27 $13.01 $9.96 $8.40 $7.05 Assume that Stock A has a required return of 13%. You will use this required return rate to discount the dividends calculated earlier. If you plan to buy the stock, hold it for three years, and then sell it for $27.05, what is the most you should pay for itStep by Step Solution
There are 3 Steps involved in it
Step: 1

Get Instant Access to Expert-Tailored Solutions
See step-by-step solutions with expert insights and AI powered tools for academic success
Step: 2

Step: 3
Ace Your Homework with AI
Get the answers you need in no time with our AI-driven, step-by-step assistance
Get Started
Developments In Entrepreneurial Finance And Technology
Authors: David B. Audretsch, Maksim Belitski, Nada Rejeb, Rosa Caiazza
1st Edition
1800884338,1800884346