Answered step by step
Verified Expert Solution
Link Copied!

Question

1 Approved Answer

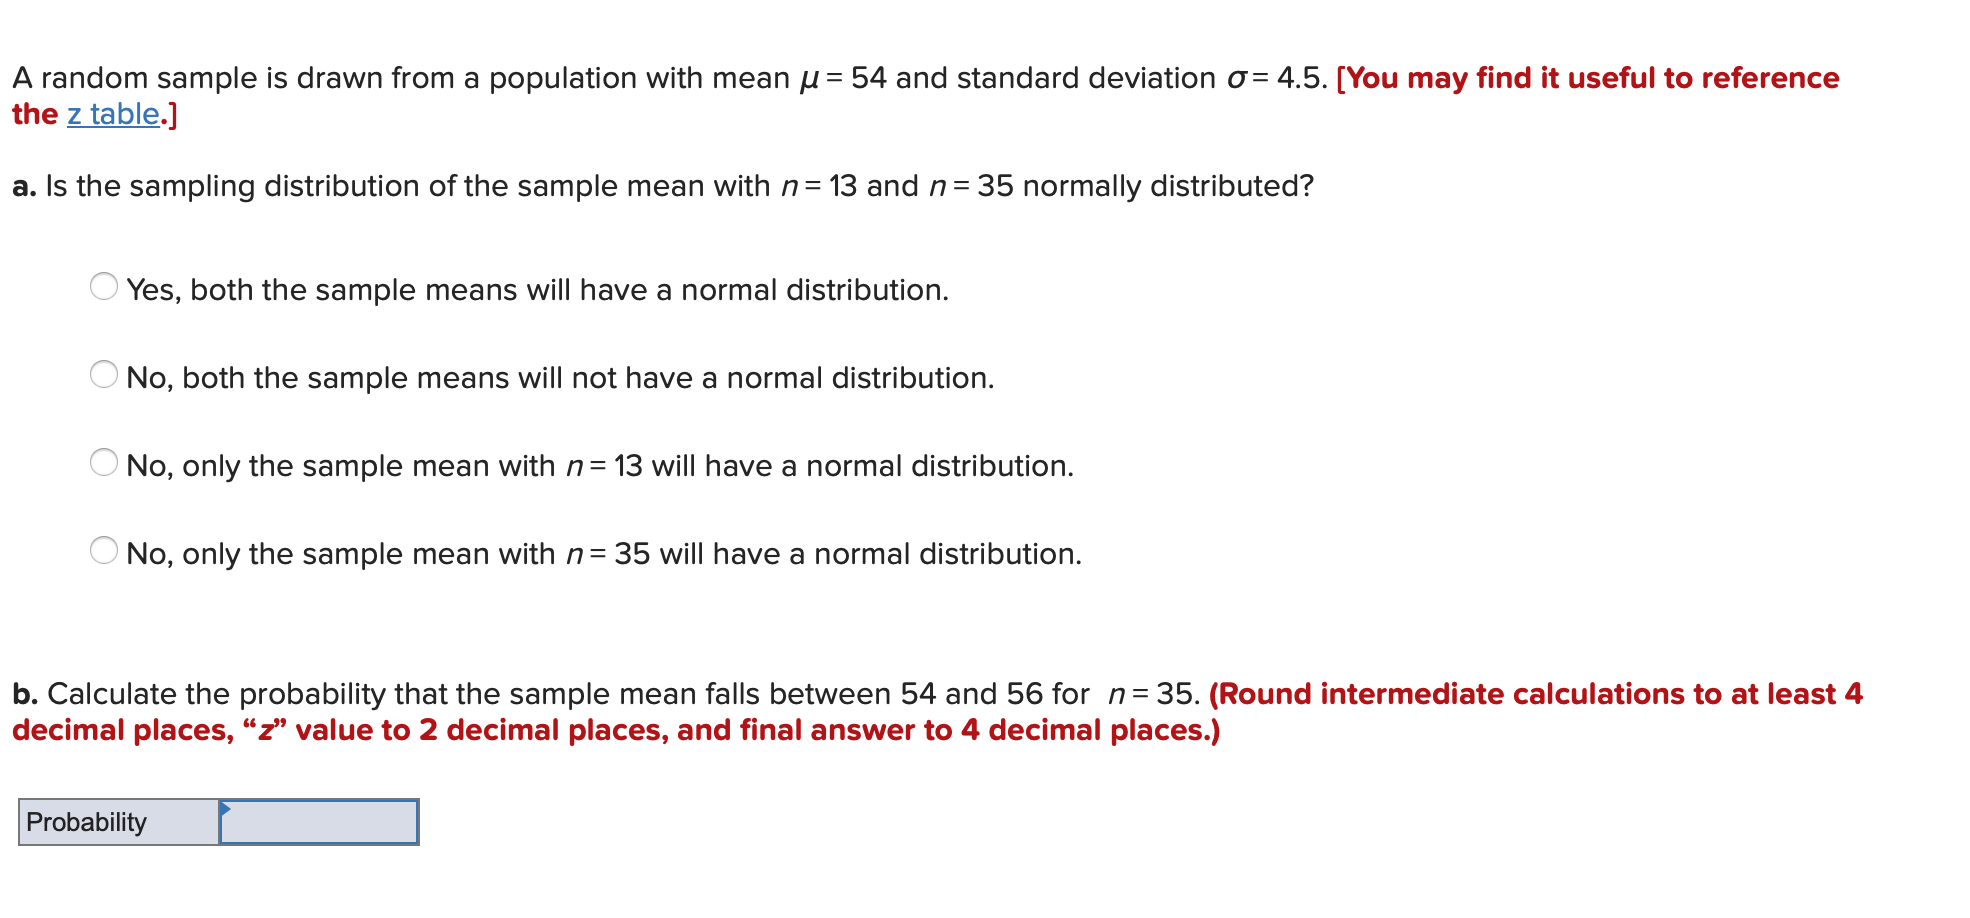
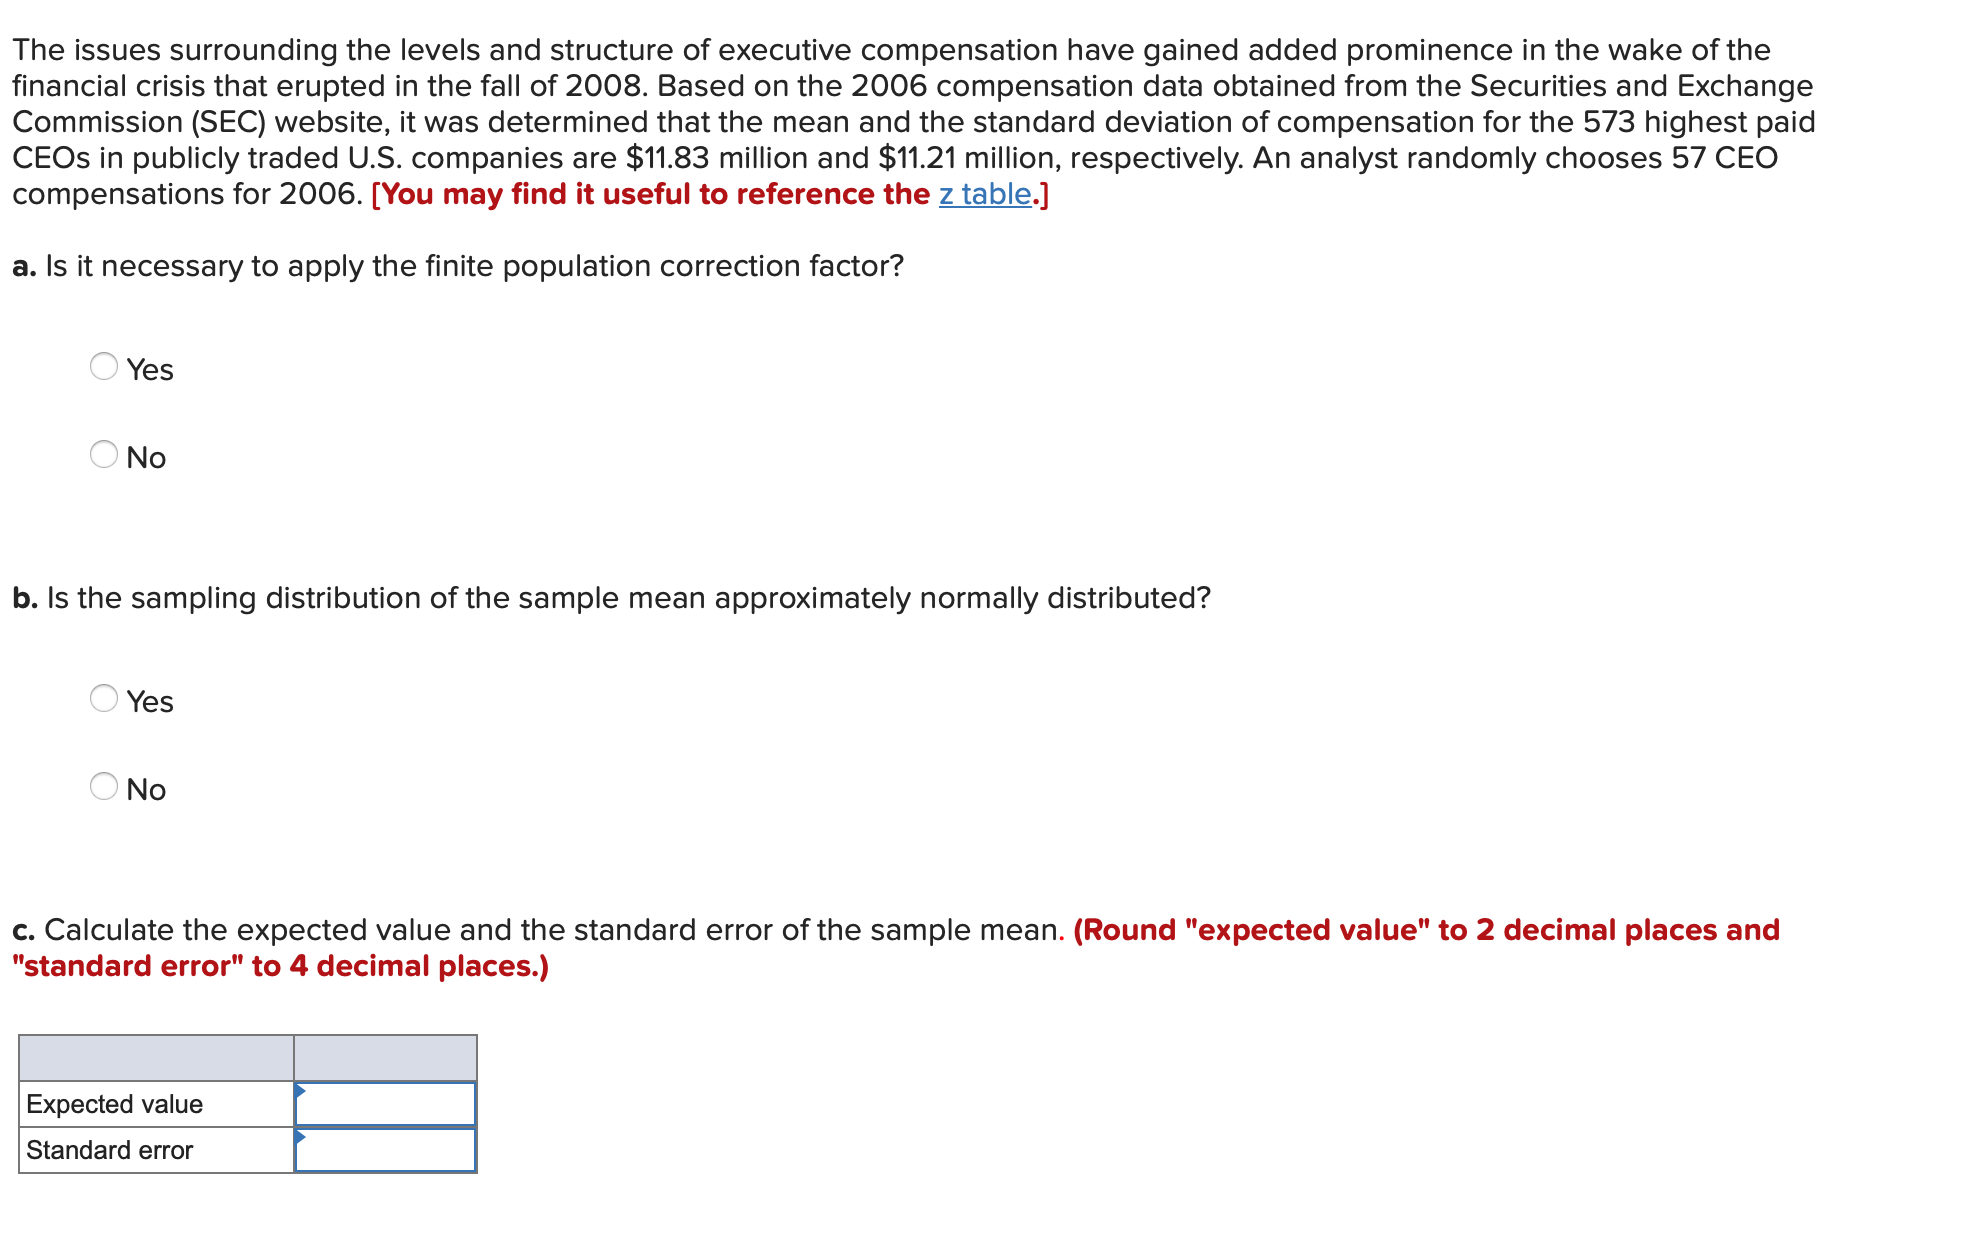
Please show all information, thank you A random sample is drawn from a population with mean / = 54 and standard deviation o= 4.5. [You

Please show all information, thank you

image text in transcribedimage text in transcribedimage text in transcribedimage text in transcribedimage text in transcribedimage text in transcribedimage text in transcribedimage text in transcribedimage text in transcribedimage text in transcribedimage text in transcribed
A random sample is drawn from a population with mean / = 54 and standard deviation o= 4.5. [You may find it useful to reference the z table.] a. Is the sampling distribution of the sample mean with n = 13 and n = 35 normally distributed? O Yes, both the sample means will have a normal distribution. ONo, both the sample means will not have a normal distribution. O No, only the sample mean with n = 13 will have a normal distribution. O No, only the sample mean with n = 35 will have a normal distribution. b. Calculate the probability that the sample mean falls between 54 and 56 for n = 35. (Round intermediate calculations to at least 4 decimal places, "z" value to 2 decimal places, and final answer to 4 decimal places.) ProbabilityBeer bottles are filled so that they contain an average of 335 ml of beer in each bottle. Suppose that the amount of beer in a bottle is normally distributed with a standard deviation of7 ml. [You may find it useful to reference the 2 table.] a. What is the probability that a randomly selected bottle will have less than 332 ml of beer? (Round intermediate calculations to at least 4 decimal places, \"2" value to 2 decimal places, and final answer to 4 decimal places.) iibbabiiiiy _ b. What is the probability that a randomly selected 6pack of beer will have a mean amount less than 332 ml? (Round intermediate calculations to at least 4 decimal places, \"2\" value to 2 decimal places. and final answer to 4 decimal places.) c. What is the probability that a randomly selected 12-pack of beer will have a mean amount less than 332 ml? (Round intermediate calculations to at least 4 decimal places, \"2" value to 2 decimal places, and final answer to 4 decimal places.) iiibbabiiiy _ Consider a population proportion p = 0.37. [You may find it useful to reference the z table.] a. Calculate the standard error for the sampling distribution of the sample proportion when n = 10 and n = 75? (Round your final answer to 4 decimal places.) n Standard error 10 75 b. Is the sampling distribution of the sample proportion approximately normal with n = 10 and n = 75? n Approximately normal 10 75c. Calculate the probability that the sample proportion is between 0.35 and 0.37 for n = 75. (Round "z-value" to 2 decimal places and final answer to 4 decimal places.) The issues surrounding the levels and structure of executive compensation have gained added prominence in the wake of the financial crisis that erupted in the fall of 2008. Based on the 2006 compensation data obtained from the Securities and Exchange Commission (SEC) website, it was determined that the mean and the standard deviation of compensation for the 573 highest paid CEOs in publicly traded US. companies are $11.83 million and $11.21 million, respectively. An analyst randomly chooses 57 CEO compensations for 2006. [You may nd it useful to reference the z ta ble.] a. Is it necessary to apply the nite population correction factor? KN ' Yes A "No b. Is the sampling distribution of the sample mean approximately normally distributed? '\\ , I Yes A "No c. Calculate the expected value and the standard error of the sample mean. (Round "expected value" to 2 decimal places and "standard error" to 4 decimal places.) Expected value _ Standard error _ Consider a normally distributed population with mean = 106 and standard deviation o= 16. a. Calculate the centerline, the upper control limit (UCL), and the lower control limit (LCL) for the X chart if samples of size 10 are used. (Round the value for the centerline to the nearest whole number and the values for the UCL and LCL to 2 decimal places.) Centerline Upper Control Limit Lower Control Limit b. Calculate the centerline, the upper control limit (UCL), and the lower control limit (LCL) for the chart if samples of size 20 are used. (Round the value for the centerline to the nearest whole number and the values for the UCL and LCL to 2 decimal places.) Centerline Upper Control Limit Lower Control Limitc. Discuss the effect of the sample size on the control limits. The larger sample size gives control limits due to the standard error.Random samples of size n = 350 are taken from a population with p = 0.04. a. Calculate the centerline, the upper control limit (UCL), and the lower control limit (LCL) for the p chart. (Round the value for the centerline to 2 decimal places and the values for the UCL and LCL to 3 decimal places.) Centerline Upper Control Limit Lower Control Limit b. Calculate the centerline, the upper control limit (UCL), and the lower control limit (LCL) for the p chart if samples of 230 are used. (Round the value for the centerline to 2 decimal places and the values for the UCL and LCL to 3 decimal places.) Centerline Upper Control Limit Lower Control Limit c. Discuss the effect of the sample size on the control limits.c. Discuss the effect of the sample size on the control limits. The control limits have a spread with smaller sample sizes due to the standard error for the smaller sample size.A manufacturing process produces steel rods in batches of 1.800. The rm believes that the percent of defective items generated by this process is 5.5%. a. Calculate the centerline, the upper control limit (UCL), and the lower control limit (LCL) for the P chart. (Round your answers to 3 decimal places.) Centerline Upper Control Limit Lower Control Limit b. An engineer inspects the next batch of 1,800 steel rods and nds that 6.6% are defective. Is the manufacturing process under control? A' Yes, because the sample proportion lies within the control limits. A Yes, because the sample proportion lies below the lower control limit. 'A' No, because the sample proportion lies between the upper and lower control limits. '.A' No, because the sample proportion lies below the lower control limit. A production process is designed to fill boxes with an average of 16 ounces of cereal. The population of filling weights is normally distributed with a standard deviation of 2 ounces. a. Calculate the centerline, the upper control limit (UCL), and the lower control limit (LCL) for the )7 chart if samples of 10 boxes are taken. (Round the value for the centerline to the nearest whole number and the values for the UCL and LCL to 3 decimal places.) b. Analysts obtain the following sample means after a recent inspection of the production process. Can they conclude that the process is under control? f1: 14.8 172 = 15.5 173 = 14.7 364 = 14.2 $5 = 14.7 is = 15.3 A Yes . because all sample means lie within the control limits .and there is no systematic pattern. 'A' Yes . because some sample means lie outside the control limits. 1A No . because some sample means lie outside the control limits. 'A' No . because even though all sample means lie within the control limits .there is a negative trend

Step by Step Solution

There are 3 Steps involved in it

Step: 1

blur-text-image

Get Instant Access to Expert-Tailored Solutions

See step-by-step solutions with expert insights and AI powered tools for academic success

Step: 2

blur-text-image

Step: 3

blur-text-image

Ace Your Homework with AI

Get the answers you need in no time with our AI-driven, step-by-step assistance

Get Started

Recommended Textbook for

From Calculus To Analysis

Authors: Steen Pedersen

1st Edition

3319136410, 9783319136417

More Books

Students also viewed these Mathematics questions

Question

3. How can we confi rm both ourselves and others?

Answered: 1 week ago

Question

2. In what ways can confl ict enrich relationships?

Answered: 1 week ago