

Answered step by step
Verified Expert Solution
Question
1 Approved Answer
Please show all work. 2. OPTIMAL HEDGE RATIO The following table presents se standard deviations of spot The table also lists the siz hedging. The
Please show all work.
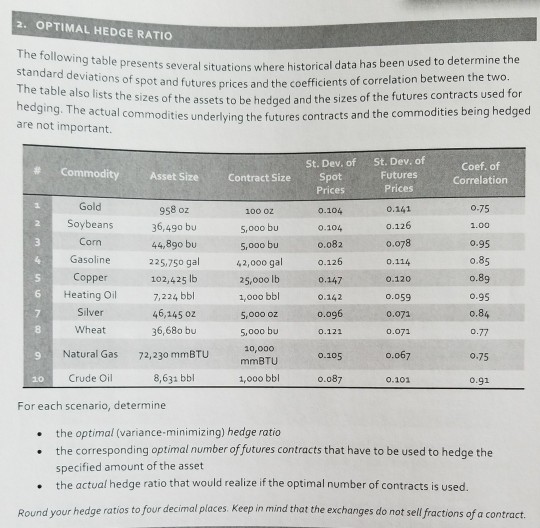
2. OPTIMAL HEDGE RATIO The following table presents se standard deviations of spot The table also lists the siz hedging. The actual commodities are not important. veral situations where historical data has been used to determine the and futures prices and the coefficients of correlation between the two. es of the assets to be hedged and the sizes of the futures contracts used for underlying the futures contracts and the commodities being hedged St. Dev. of Futures Prices St. Dev. of Prices 0.104 0.104 o.082 Coef. of Correlation Commodity Asset SizeContract SizeSpot Gold Soybeans Corn Gasoline Copper Heating Oil Silver Wheat 958 oz 36,490 bu 44,89o bu 225,750 ga 102,425 lb 7,224 bbl 46,145 oz 36,68o bu 72,230 mmBTU 8,631 bbl 0.141 100 oz s,ooo bu S,000 bu 2.00 0.95 0.85 0.126 0.078 0.114 0.120 25,o0o lb 1,000 bbl 5,000 o2 5,o00 bu 10,000 0.147 0.142 o.og6 0.122 6 0.059 0.95 0.073 8 9 Natural Gas o.105 0.75 mmBTU 20 Crude Oil 1,000 bbl 0.087 0.101 For each scenario, determine .the optimal (variance-minimizing) hedge ratio the corresponding optimal number of futures contracts that have to be used to hedge the specified amount of the asset . the actual hedge ratio that would realize if the optimal number of contracts is used Round your hedge ratios to four decimal places Keep in mind that the exchanges do not sell factions of a contractStep by Step Solution
There are 3 Steps involved in it
Step: 1

Get Instant Access to Expert-Tailored Solutions
See step-by-step solutions with expert insights and AI powered tools for academic success
Step: 2

Step: 3
Ace Your Homework with AI
Get the answers you need in no time with our AI-driven, step-by-step assistance
Get Started
Currency Wars Offense And Defense Through Systemic Thinking
Authors: Jeffrey Yi-Lin Forrest , Yirong Ying , Zaiwu Gong
1st Edition
3319677640,3319677659