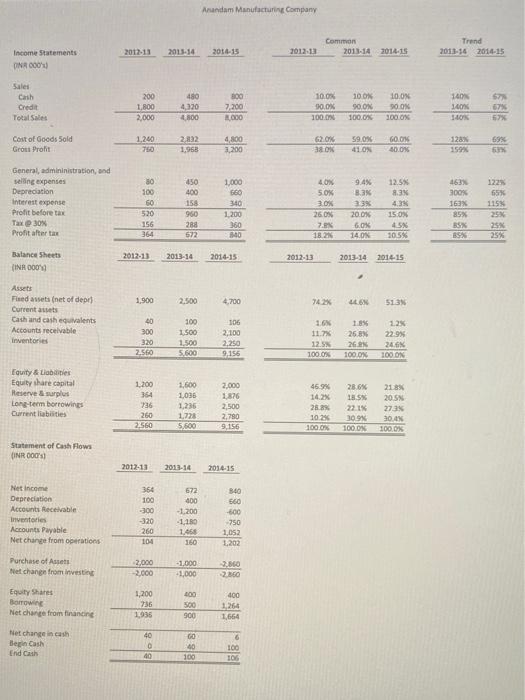
please show all work and use excel and other graphs if needed


Using the 2014-15 financials and ratios from Anandam Manufacturing Case (located in Module 15) calculate: The cash conversion cycle-assume current liabilities is the same as accounts payable (1 pt) . The nominal and effective cost of trade credit if the company offered 2/10 net 30 to its credit paying customers. (2 pts) Income Statements ON 000 Sales Cash Credit Total Sales Cost of Goods Sold Gross Profit General, admininistration, and selling expenses Depreciation Interest expense Profit before tax Tax @ 30% Profit after tax Balance Sheets (INR 000 Assets Fixed assets (net of depr Current assets Cash and cash equivalents Accounts receivable inventories Equity & Liabilities Equity share capital Reserve & surplus Long-term borrowings Current liabilities Statement of Cash Flows (INR 000's) Net Income Depreciation Accounts Receivable Inventories Accounts Payable Net change from operations Purchase of Assets Net change from investing Equity Shares Borrowing Net change from financing Net change in cash Begin Cash End Cash 2012-13 2012-13 200 480 800 1,800 4,320 7,200 2,000 4,800 8,000 1,240 2,832 4,800 1,968 3,200 80 450 1,000 100 400 660 60 158 340 520 960 1,200 156 288 360 364 672 840 2012-13 2013-14 2014-15 1,900 2,500 4,700 40 100 106 300 1,500 2,100 320 1,500 2.250 2.560 5,600 9,156 1,200 1,600 2,000 364 1,036 1,876 736 1,236 2,500 260 1,728 2,780 2.560 5,600 9,156 2013-14 2014-15 672 400 -1,200 -1,180 1,468 160 -1.000 -1,000 400 500 900 GO 40 100 364 100 -300 -320 260 104 -2,000 -2,000 1,200 736 1,936 40 0 2013-14 40 Anandam Manufacturing Company 2014-15 2012-13 840 660 -600 -750 1,052 1,202 -2,860 2,860 400 1,264 1,664 6 100 106 Common 2013-14 2014-15 10.0% 10.0% 10.0% 90.0% 90.0% 90.0% 100.0% 100.0% 100.0% 62.0% 59.0% 60.0% 38.0% 41.0% 40.0% 4.0% 9.4% 12.5% 5.0% 8.3% 8.3% 3.0% 3.3% 4.3% 26.0% 7.8% 18.2% 20.0% 15.0% 6.0% 4.5% 14.0% 10.5% 2013-14 2014-15 44.6% 51.3% 1.8% 1.2% 11.7% 26.8% 22.9% 12.5% 26.2% 24.6% 100.0% 100.0% 100.0% 46.9% 28.6% 21.8% 14.2% 18.5% 20.5% 28.8% 22.1% 27.3% 10.2% 30.9% 30.4% 100.0% 100.0% 100.0% 2012-13 74.2% 1.6% Trend 2013-14 2014-15 140% 67% 140% 67% 140% 128% 69% 159% 63% 463% 122% 300% 65% 163% 115% 85% 25% 85% 25% 85% 25% Using the 2014-15 financials and ratios from Anandam Manufacturing Case (located in Module 15) calculate: The cash conversion cycle-assume current liabilities is the same as accounts payable (1 pt) . The nominal and effective cost of trade credit if the company offered 2/10 net 30 to its credit paying customers. (2 pts) Income Statements ON 000 Sales Cash Credit Total Sales Cost of Goods Sold Gross Profit General, admininistration, and selling expenses Depreciation Interest expense Profit before tax Tax @ 30% Profit after tax Balance Sheets (INR 000 Assets Fixed assets (net of depr Current assets Cash and cash equivalents Accounts receivable inventories Equity & Liabilities Equity share capital Reserve & surplus Long-term borrowings Current liabilities Statement of Cash Flows (INR 000's) Net Income Depreciation Accounts Receivable Inventories Accounts Payable Net change from operations Purchase of Assets Net change from investing Equity Shares Borrowing Net change from financing Net change in cash Begin Cash End Cash 2012-13 2012-13 200 480 800 1,800 4,320 7,200 2,000 4,800 8,000 1,240 2,832 4,800 1,968 3,200 80 450 1,000 100 400 660 60 158 340 520 960 1,200 156 288 360 364 672 840 2012-13 2013-14 2014-15 1,900 2,500 4,700 40 100 106 300 1,500 2,100 320 1,500 2.250 2.560 5,600 9,156 1,200 1,600 2,000 364 1,036 1,876 736 1,236 2,500 260 1,728 2,780 2.560 5,600 9,156 2013-14 2014-15 672 400 -1,200 -1,180 1,468 160 -1.000 -1,000 400 500 900 GO 40 100 364 100 -300 -320 260 104 -2,000 -2,000 1,200 736 1,936 40 0 2013-14 40 Anandam Manufacturing Company 2014-15 2012-13 840 660 -600 -750 1,052 1,202 -2,860 2,860 400 1,264 1,664 6 100 106 Common 2013-14 2014-15 10.0% 10.0% 10.0% 90.0% 90.0% 90.0% 100.0% 100.0% 100.0% 62.0% 59.0% 60.0% 38.0% 41.0% 40.0% 4.0% 9.4% 12.5% 5.0% 8.3% 8.3% 3.0% 3.3% 4.3% 26.0% 7.8% 18.2% 20.0% 15.0% 6.0% 4.5% 14.0% 10.5% 2013-14 2014-15 44.6% 51.3% 1.8% 1.2% 11.7% 26.8% 22.9% 12.5% 26.2% 24.6% 100.0% 100.0% 100.0% 46.9% 28.6% 21.8% 14.2% 18.5% 20.5% 28.8% 22.1% 27.3% 10.2% 30.9% 30.4% 100.0% 100.0% 100.0% 2012-13 74.2% 1.6% Trend 2013-14 2014-15 140% 67% 140% 67% 140% 128% 69% 159% 63% 463% 122% 300% 65% 163% 115% 85% 25% 85% 25% 85% 25%


