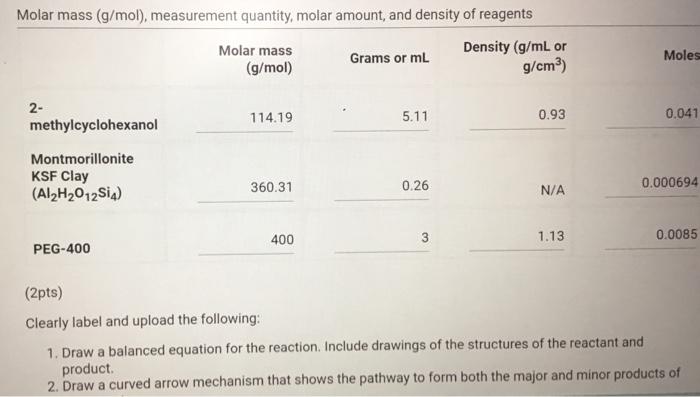
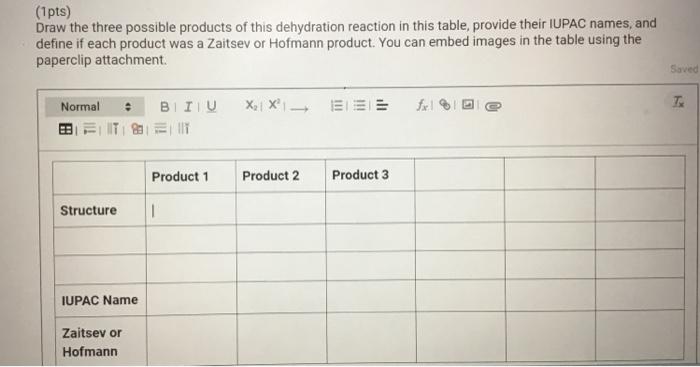
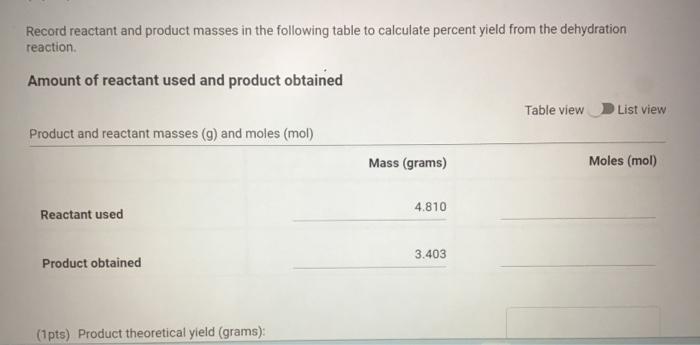
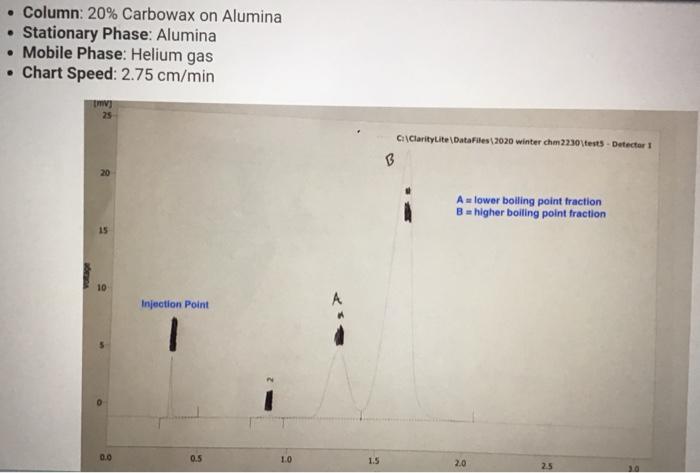
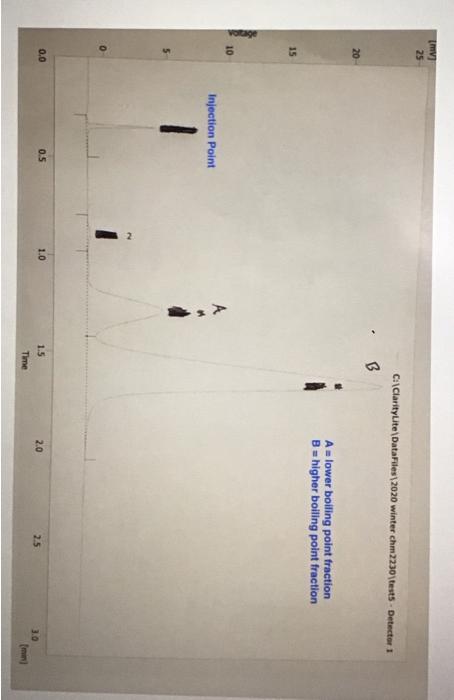
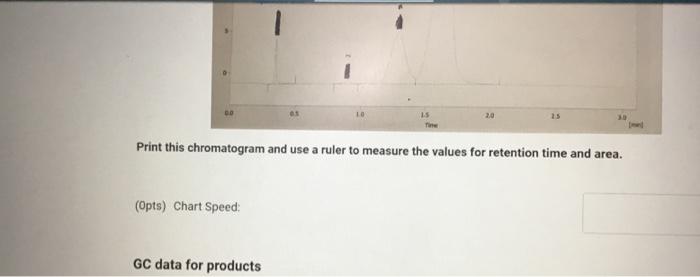
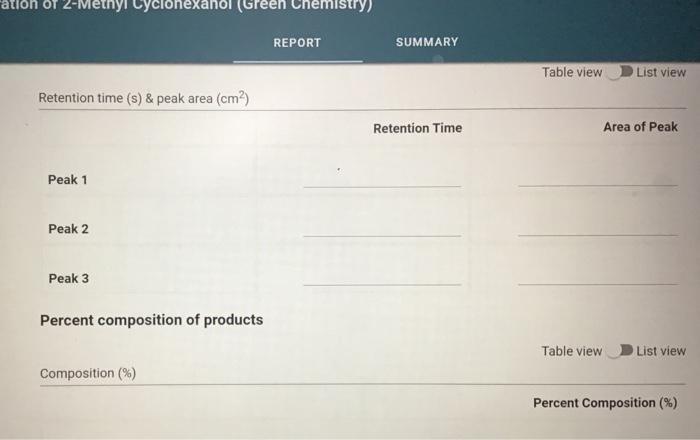
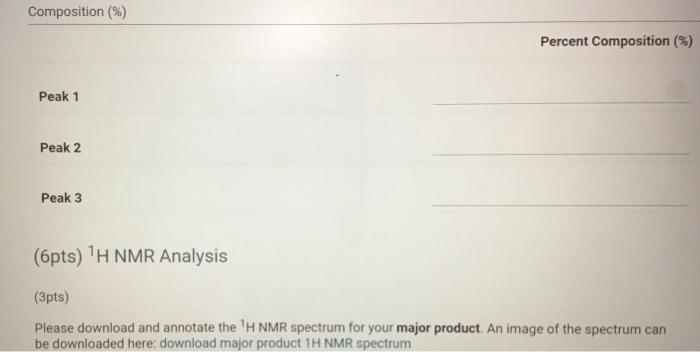
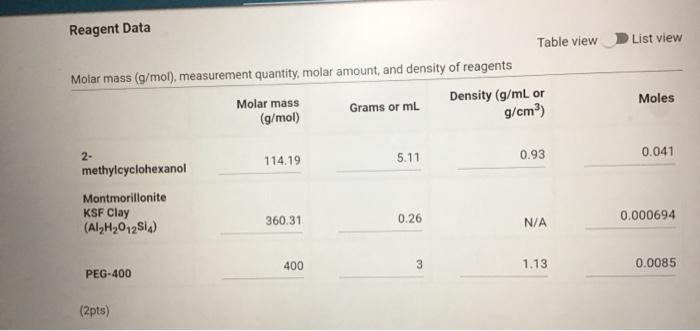
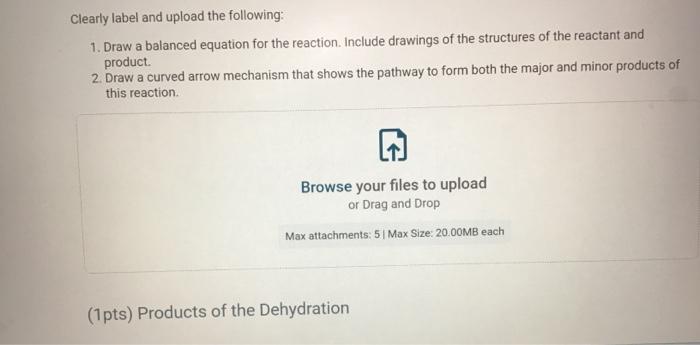
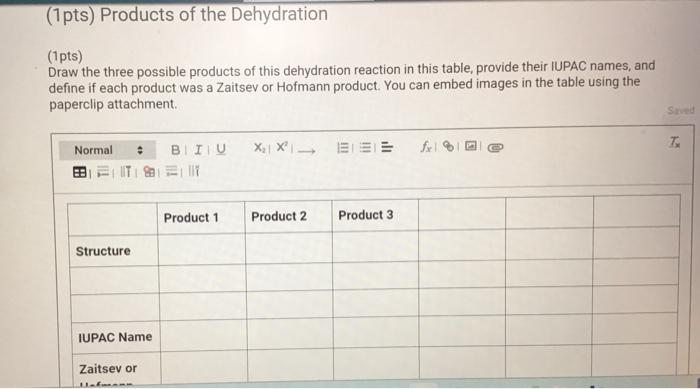
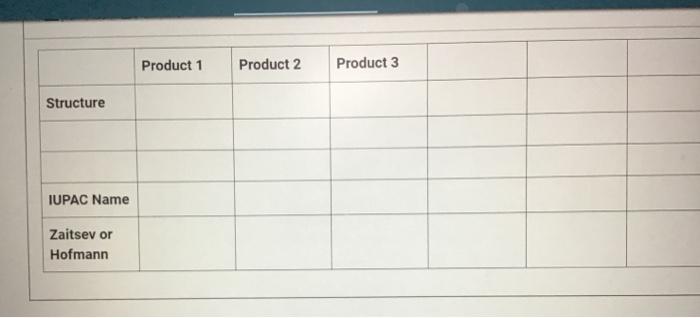
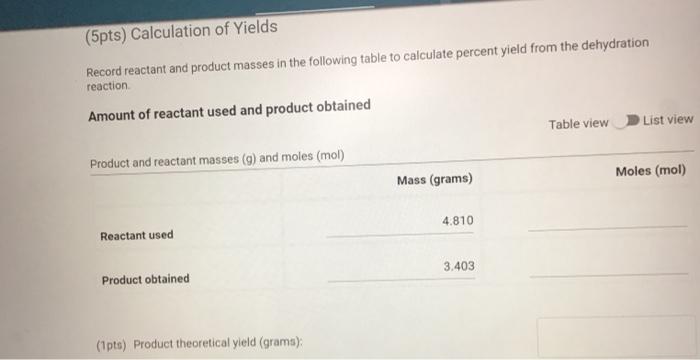
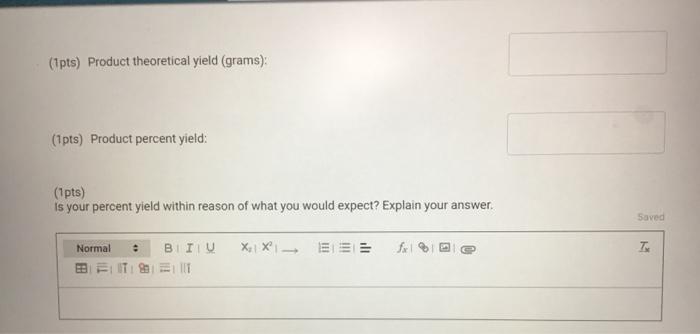
Molar mass (g/mol), measurement quantity, molar amount, and density of reagents (2pts) Clearly label and upload the following: 1. Draw a balanced equation for the reaction. Include drawings of the structures of the reactant and product. 2. Draw a curved arrow mechanism that shows the pathway to form both the major and minor products of Clearly label and upload the following: 1. Draw a balanced equation for the reaction. Include drawings of the structures of the reactant and product. 2. Draw a curved arrow mechanism that shows the pathway to form both the major and minor products of this reaction. (1pts) Draw the three possible products of this dehydration reaction in this table, provide their IUPAC names, and define if each product was a Zaitsev or Hofmann product. You can embed images in the table using the paperclip attachment. Record reactant and product masses in the following table to calculate percent yield from the dehydration reaction. Amount of reactant used and product obtained - Column: 20% Carbowax on Alumina - Stationary Phase: Alumina - Mobile Phase: Helium gas - Chart Speed: 2.75cm/min Print this chromatogram and use a ruler to measure the values for retention time and area. (Opts) Chart Speed: GC data for products Table view D List view Retention time (s) \& peak area (cm2) Retention Time Area of Peak Peak 1 Peak 2 Peak 3 Percent composition of products Table view D List view Composition (\%) Percent Composition (\%) Percent Composition (\%) Peak 1 Peak 2 Peak 3 (6pts) 1H NMR Analysis (3pts) Please download and annotate the 1H NMR spectrum for your major product. An image of the spectrum can be downloaded here: download major product 1H NMR spectrum Reagent Data Table view List view Clearly label and upload the following: 1. Draw a balanced equation for the reaction. Include drawings of the structures of the reactant and product. 2. Draw a curved arrow mechanism that shows the pathway to form both the major and minor products of this reaction. Browse your files to upload or Drag and Drop Max attachments: 5 I Max Size: 20.00MB each (1pts) Products of the Dehydration (1pts) Draw the three possible products of this dehydration reaction in this table, provide their IUPAC names, and define if each product was a Zaitsev or Hofmann product. You can embed images in the table using the paperclip attachment. \begin{tabular}{|l|l|l|l|l|} \hline & Product 1 & Product 2 & Product 3 & \\ \hline Structure & & & & \\ \hline & & & & \\ \hline & & & \\ \hline IUPAC Name & & & \\ \hline ZaitsevorHofmann & & & \\ \hline \end{tabular} (5pts) Calculation of Yields Record reactant and product masses in the following table to calculate percent yield from the dehydration reaction. Amount of reactant used and product obtained Table view List vie (1pts) Product theoretical yleld (grams): (1pts) Product theoretical yield (grams): (1pts) Product percent yield: (1pts) is your percent yield within reason of what you would expect? Explain your answer. Molar mass (g/mol), measurement quantity, molar amount, and density of reagents (2pts) Clearly label and upload the following: 1. Draw a balanced equation for the reaction. Include drawings of the structures of the reactant and product. 2. Draw a curved arrow mechanism that shows the pathway to form both the major and minor products of Clearly label and upload the following: 1. Draw a balanced equation for the reaction. Include drawings of the structures of the reactant and product. 2. Draw a curved arrow mechanism that shows the pathway to form both the major and minor products of this reaction. (1pts) Draw the three possible products of this dehydration reaction in this table, provide their IUPAC names, and define if each product was a Zaitsev or Hofmann product. You can embed images in the table using the paperclip attachment. Record reactant and product masses in the following table to calculate percent yield from the dehydration reaction. Amount of reactant used and product obtained - Column: 20% Carbowax on Alumina - Stationary Phase: Alumina - Mobile Phase: Helium gas - Chart Speed: 2.75cm/min Print this chromatogram and use a ruler to measure the values for retention time and area. (Opts) Chart Speed: GC data for products Table view D List view Retention time (s) \& peak area (cm2) Retention Time Area of Peak Peak 1 Peak 2 Peak 3 Percent composition of products Table view D List view Composition (\%) Percent Composition (\%) Percent Composition (\%) Peak 1 Peak 2 Peak 3 (6pts) 1H NMR Analysis (3pts) Please download and annotate the 1H NMR spectrum for your major product. An image of the spectrum can be downloaded here: download major product 1H NMR spectrum Reagent Data Table view List view Clearly label and upload the following: 1. Draw a balanced equation for the reaction. Include drawings of the structures of the reactant and product. 2. Draw a curved arrow mechanism that shows the pathway to form both the major and minor products of this reaction. Browse your files to upload or Drag and Drop Max attachments: 5 I Max Size: 20.00MB each (1pts) Products of the Dehydration (1pts) Draw the three possible products of this dehydration reaction in this table, provide their IUPAC names, and define if each product was a Zaitsev or Hofmann product. You can embed images in the table using the paperclip attachment. \begin{tabular}{|l|l|l|l|l|} \hline & Product 1 & Product 2 & Product 3 & \\ \hline Structure & & & & \\ \hline & & & & \\ \hline & & & \\ \hline IUPAC Name & & & \\ \hline ZaitsevorHofmann & & & \\ \hline \end{tabular} (5pts) Calculation of Yields Record reactant and product masses in the following table to calculate percent yield from the dehydration reaction. Amount of reactant used and product obtained Table view List vie (1pts) Product theoretical yleld (grams): (1pts) Product theoretical yield (grams): (1pts) Product percent yield: (1pts) is your percent yield within reason of what you would expect? Explain your
