

Answered step by step
Verified Expert Solution
Question
1 Approved Answer
please show all work! thank you! Part 2. Finding A New Car When trying to decide what car to buy, real value is not necessarily
please show all work! thank you! 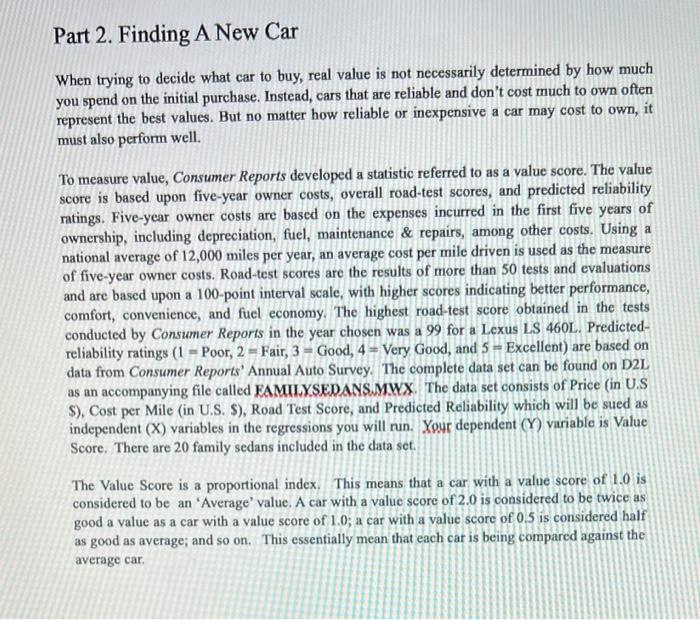
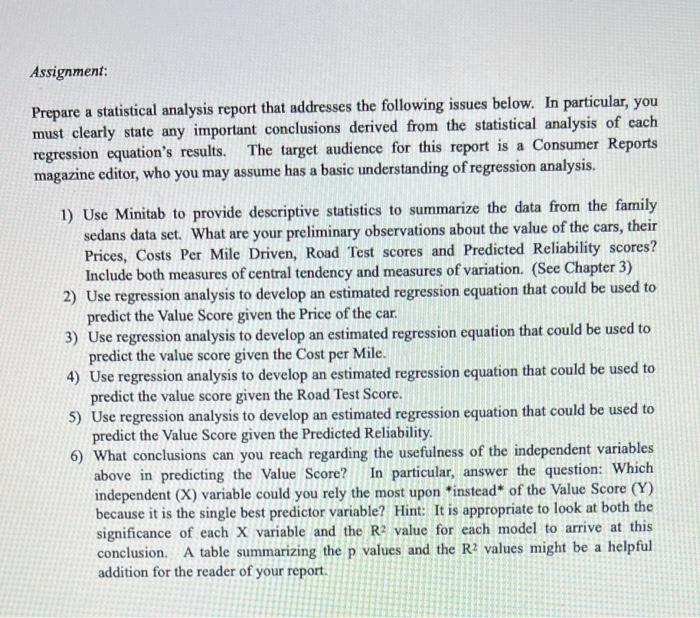
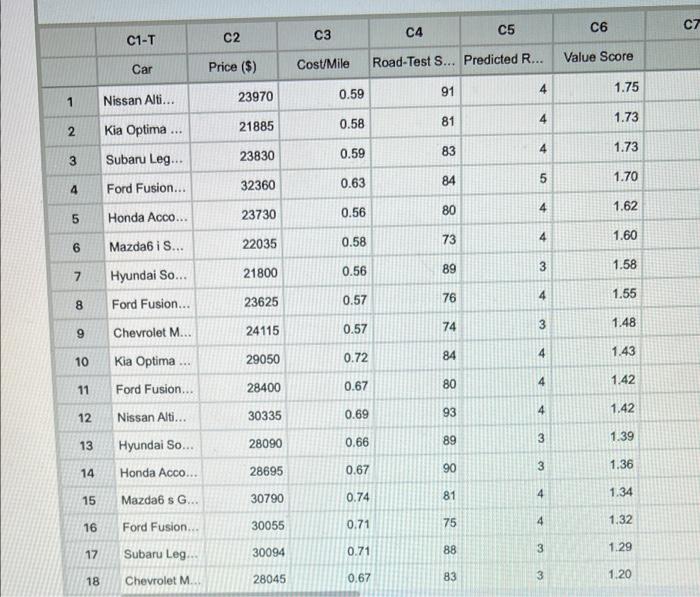
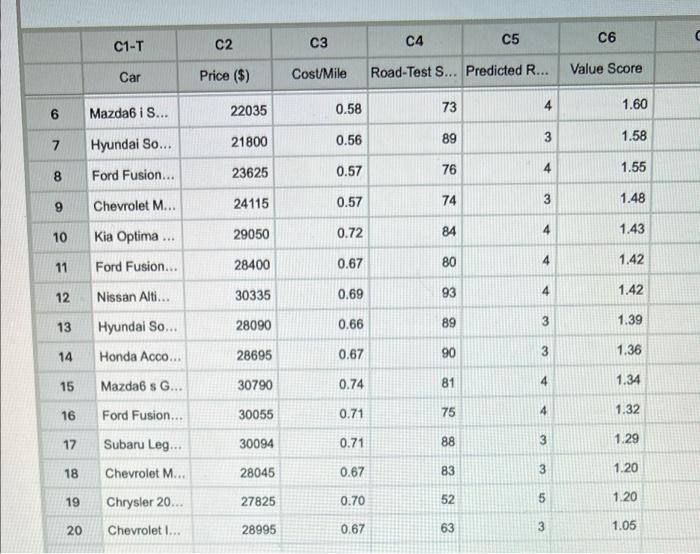
Part 2. Finding A New Car When trying to decide what car to buy, real value is not necessarily determined by how much you spend on the initial purchase. Instead, cars that are reliable and don't cost much to own often represent the best values. But no matter how reliable or inexpensive a car may cost to own, it must also perform well. a To measure value, Consumer Reports developed a statistic referred to as a value score. The value score is based upon five-year owner costs, overall road-test scores, and predicted reliability ratings. Five-year owner costs are based on the expenses incurred in the first five years of ownership, including depreciation, fuel, maintenance & repairs, among other costs. Using a national average of 12,000 miles per year, an average cost per mile driven is used as the measure of five-year owner costs. Road-test scores are the results of more than 50 tests and evaluations and are based upon a 100-point interval scale, with higher scores indicating better performance, comfort, convenience, and fuel economy. The highest road-test score obtained in the tests conducted by Consumer Reports in the year chosen was a 99 for a Lexus LS 460L. Predicted- reliability ratings (1 = Poor, 2 = Fair, 3 = Good, 4 = Very Good, and 5 = Excellent) are based on data from Consumer Reports Annual Auto Survey. The complete data set can be found on D2L as an accompanying file called FAMILYSEDANS.MWX The data set consists of Price (in U.S S), Cost per Mile (in U.S. S), Road Test Score, and Predicted Reliability which will be sued as independent (X) variables in the regressions you will run. Your dependent (Y) variable is Value Score. There are 20 family sedans included in the data set. The Value Score is a proportional index. This means that a car with a value score of 1.0 is considered to be an 'Average' value. A car with a value score of 2.0 is considered to be twice as good a value as a car with a value score of 1.0; a car with a value score of 0.5 is considered half as good as average, and so on. This essentially mean that each car is being compared against the average car. Assignment: Prepare a statistical analysis report that addresses the following issues below. In particular, you must clearly state any important conclusions derived from the statistical analysis of cach regression equation's results. The target audience for this report is a Consumer Reports magazine editor, who you may assume has a basic understanding of regression analysis. 1) Use Minitab to provide descriptive statistics to summarize the data from the family sedans data set. What are your preliminary observations about the value of the cars, their Prices, Costs Per Mile Driven, Road Test scores and Predicted Reliability scores? Include both measures of central tendency and measures of variation. (See Chapter 3) 2) Use regression analysis to develop an estimated regression equation that could be used to predict the Value Score given the Price of the car. 3) Use regression analysis to develop an estimated regression equation that could be used to predict the value score given the Cost per Mile. 4) Use regression analysis to develop an estimated regression equation that could be used to predict the value score given the Road Test Score. 5) Use regression analysis to develop an estimated regression equation that could be used to predict the Value Score given the Predicted Reliability. 6) What conclusions can you reach regarding the usefulness of the independent variables above in predicting the Value Score? In particular, answer the question: Which independent (X) variable could you rely the most upon instead of the Value Score (Y) because it is the single best predictor variable? Hint: It is appropriate to look at both the significance of each X variable and the R2 value for each model to arrive at this conclusion. A table summarizing the p values and the R2 values might be a helpful addition for the reader of your report. C6 C5 C7 C1-T C2 C4 C3 Car Value Score Price ($) Cost/Mile Road-Test S... Predicted R... 4 91 1.75 0.59 1 23970 Nissan Alti... 81 4 1.73 2 0.58 Kia Optima ... 21885 4 83 0.59 4 1.73 3 23830 Subaru Leg... 5 84 0.63 1.70 4 32360 Ford Fusion... 4 80 1.62 5 23730 0.56 Honda Acco... 4 73 1.60 6 Mazda6 i S... 22035 0.58 89 3 3 1.58 7 21800 0.56 Hyundai So... 4 76 1.55 8 23625 Ford Fusion... 0.57 3 1.48 9 Chevrolet M... 0.57 74 24115 3 4 4 84 10 0.72 1.43 29050 Kia Optima... 80 11 1.42 28400 0.67 Ford Fusion... 12 4 0.69 1.42 Nissan Alti... 30335 93 13 3 1.39 89 28090 0.66 Hyundai So... 3 14 0.67 90 1.36 Honda Acco... 28695 15 4 30790 0.74 81 1.34 Mazda6 s G... Ford Fusion... 16 0.71 1.32 30055 75 4 3 17 30094 0.71 Subaru Leg... 3 1.29 88 18 28045 0.67 3 Chevrolet M 83 1.20 C1-T C2 C6 04 C5 C3 Car Cost/Mile Price ($) Value Score Road-Test S... Predicted R... 22035 73 6 0.58 4 Mazda6 i S... 1.60 89 3 7 21800 0.56 1.58 Hyundai So... 23625 8 0.57 76 4 Ford Fusion... 1.55 24115 9 0.57 74 3 Chevrolet M... 1.48 29050 84 10 0.72 4 1.43 Kia Optima... 11 28400 Ford Fusion... 0.67 4 80 1.42 12 30335 0.69 4 Nissan Alti... 93 1.42 13 28090 0.66 3 Hyundai So... 89 1.39 14 28695 0.67 3 Honda Acco. 90 3 1.36 15 4 0.74 1.34 Mazda6 s G... 30790 81 16 Ford Fusion... 30055 0.71 1.32 75 4 Subaru Leg... 30094 17 0.71 88 3 3 1.29 18 28045 Chevrolet M. 0.67 83 3 1.20 19 Chrysler 20... 27825 0.70 52 5 1.20 20 Chevrolet I... 28995 0.67 63 3 3 1.05 Part 2. Finding A New Car When trying to decide what car to buy, real value is not necessarily determined by how much you spend on the initial purchase. Instead, cars that are reliable and don't cost much to own often represent the best values. But no matter how reliable or inexpensive a car may cost to own, it must also perform well. a To measure value, Consumer Reports developed a statistic referred to as a value score. The value score is based upon five-year owner costs, overall road-test scores, and predicted reliability ratings. Five-year owner costs are based on the expenses incurred in the first five years of ownership, including depreciation, fuel, maintenance & repairs, among other costs. Using a national average of 12,000 miles per year, an average cost per mile driven is used as the measure of five-year owner costs. Road-test scores are the results of more than 50 tests and evaluations and are based upon a 100-point interval scale, with higher scores indicating better performance, comfort, convenience, and fuel economy. The highest road-test score obtained in the tests conducted by Consumer Reports in the year chosen was a 99 for a Lexus LS 460L. Predicted- reliability ratings (1 = Poor, 2 = Fair, 3 = Good, 4 = Very Good, and 5 = Excellent) are based on data from Consumer Reports Annual Auto Survey. The complete data set can be found on D2L as an accompanying file called FAMILYSEDANS.MWX The data set consists of Price (in U.S S), Cost per Mile (in U.S. S), Road Test Score, and Predicted Reliability which will be sued as independent (X) variables in the regressions you will run. Your dependent (Y) variable is Value Score. There are 20 family sedans included in the data set. The Value Score is a proportional index. This means that a car with a value score of 1.0 is considered to be an 'Average' value. A car with a value score of 2.0 is considered to be twice as good a value as a car with a value score of 1.0; a car with a value score of 0.5 is considered half as good as average, and so on. This essentially mean that each car is being compared against the average car. Assignment: Prepare a statistical analysis report that addresses the following issues below. In particular, you must clearly state any important conclusions derived from the statistical analysis of cach regression equation's results. The target audience for this report is a Consumer Reports magazine editor, who you may assume has a basic understanding of regression analysis. 1) Use Minitab to provide descriptive statistics to summarize the data from the family sedans data set. What are your preliminary observations about the value of the cars, their Prices, Costs Per Mile Driven, Road Test scores and Predicted Reliability scores? Include both measures of central tendency and measures of variation. (See Chapter 3) 2) Use regression analysis to develop an estimated regression equation that could be used to predict the Value Score given the Price of the car. 3) Use regression analysis to develop an estimated regression equation that could be used to predict the value score given the Cost per Mile. 4) Use regression analysis to develop an estimated regression equation that could be used to predict the value score given the Road Test Score. 5) Use regression analysis to develop an estimated regression equation that could be used to predict the Value Score given the Predicted Reliability. 6) What conclusions can you reach regarding the usefulness of the independent variables above in predicting the Value Score? In particular, answer the question: Which independent (X) variable could you rely the most upon instead of the Value Score (Y) because it is the single best predictor variable? Hint: It is appropriate to look at both the significance of each X variable and the R2 value for each model to arrive at this conclusion. A table summarizing the p values and the R2 values might be a helpful addition for the reader of your report. C6 C5 C7 C1-T C2 C4 C3 Car Value Score Price ($) Cost/Mile Road-Test S... Predicted R... 4 91 1.75 0.59 1 23970 Nissan Alti... 81 4 1.73 2 0.58 Kia Optima ... 21885 4 83 0.59 4 1.73 3 23830 Subaru Leg... 5 84 0.63 1.70 4 32360 Ford Fusion... 4 80 1.62 5 23730 0.56 Honda Acco... 4 73 1.60 6 Mazda6 i S... 22035 0.58 89 3 3 1.58 7 21800 0.56 Hyundai So... 4 76 1.55 8 23625 Ford Fusion... 0.57 3 1.48 9 Chevrolet M... 0.57 74 24115 3 4 4 84 10 0.72 1.43 29050 Kia Optima... 80 11 1.42 28400 0.67 Ford Fusion... 12 4 0.69 1.42 Nissan Alti... 30335 93 13 3 1.39 89 28090 0.66 Hyundai So... 3 14 0.67 90 1.36 Honda Acco... 28695 15 4 30790 0.74 81 1.34 Mazda6 s G... Ford Fusion... 16 0.71 1.32 30055 75 4 3 17 30094 0.71 Subaru Leg... 3 1.29 88 18 28045 0.67 3 Chevrolet M 83 1.20 C1-T C2 C6 04 C5 C3 Car Cost/Mile Price ($) Value Score Road-Test S... Predicted R... 22035 73 6 0.58 4 Mazda6 i S... 1.60 89 3 7 21800 0.56 1.58 Hyundai So... 23625 8 0.57 76 4 Ford Fusion... 1.55 24115 9 0.57 74 3 Chevrolet M... 1.48 29050 84 10 0.72 4 1.43 Kia Optima... 11 28400 Ford Fusion... 0.67 4 80 1.42 12 30335 0.69 4 Nissan Alti... 93 1.42 13 28090 0.66 3 Hyundai So... 89 1.39 14 28695 0.67 3 Honda Acco. 90 3 1.36 15 4 0.74 1.34 Mazda6 s G... 30790 81 16 Ford Fusion... 30055 0.71 1.32 75 4 Subaru Leg... 30094 17 0.71 88 3 3 1.29 18 28045 Chevrolet M. 0.67 83 3 1.20 19 Chrysler 20... 27825 0.70 52 5 1.20 20 Chevrolet I... 28995 0.67 63 3 3 1.05 Step by Step Solution
There are 3 Steps involved in it
Step: 1

Get Instant Access to Expert-Tailored Solutions
See step-by-step solutions with expert insights and AI powered tools for academic success
Step: 2

Step: 3
Ace Your Homework with AI
Get the answers you need in no time with our AI-driven, step-by-step assistance
Get Started
Beyond Greed And Fear Understanding Behavioral Finance And The Psychology Of Investing
Authors: Hersh Shefrin
1st Edition
0195161211, 978-0195161212