Please show all work using the equation tool on microsoft word, so that it'll be easier to see and be more understandable. Thank you.
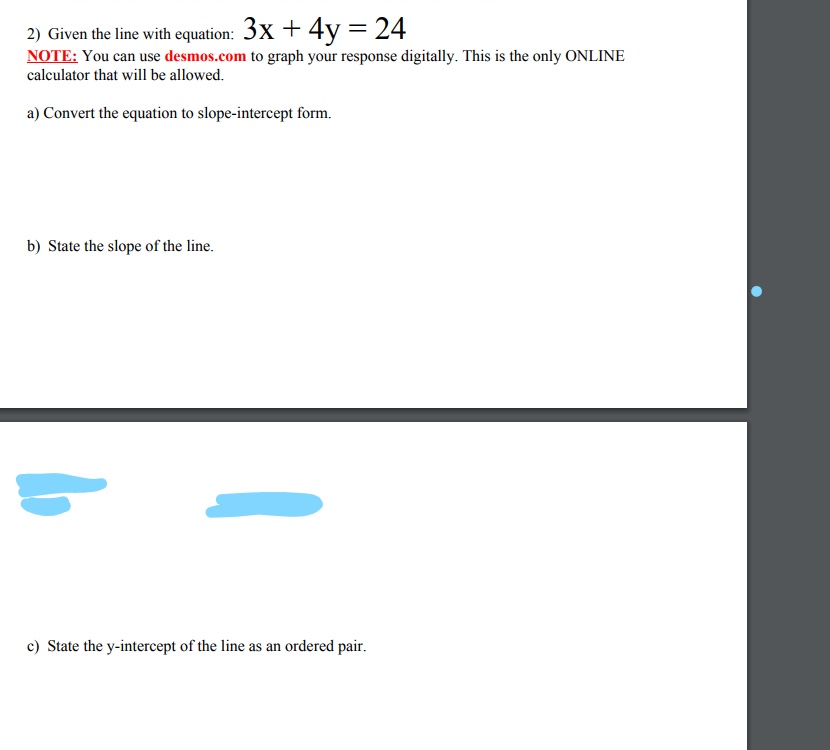
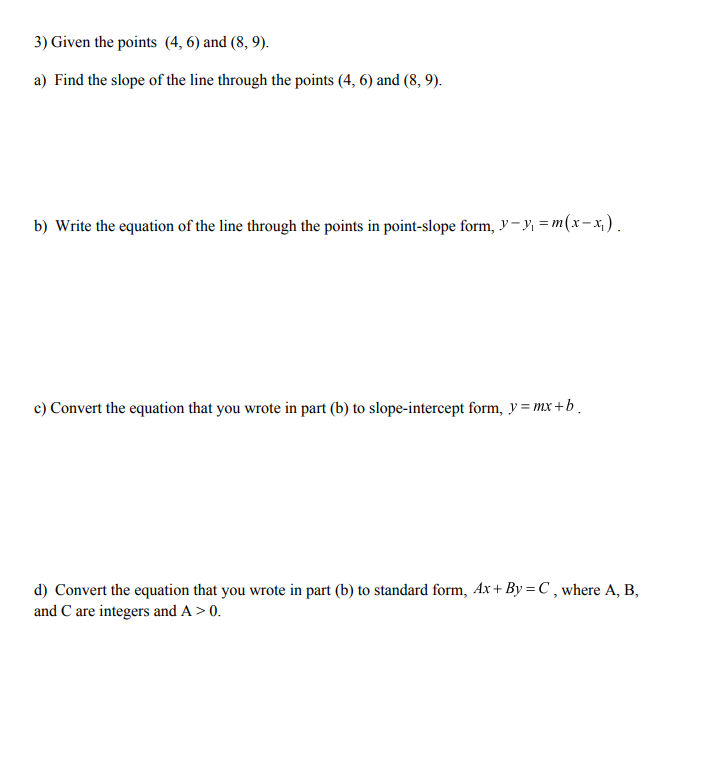
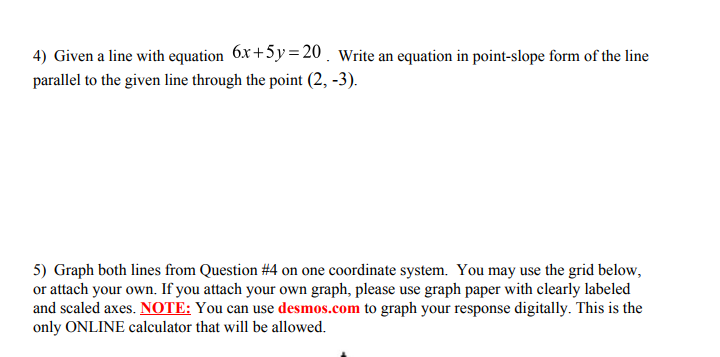
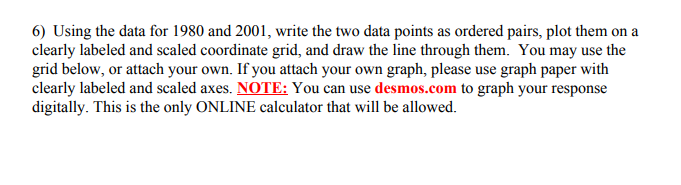
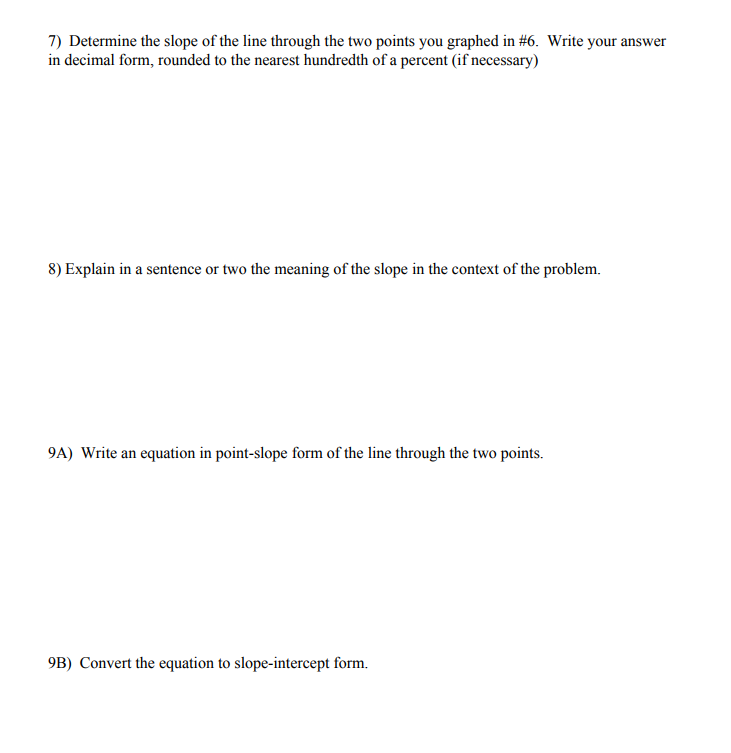
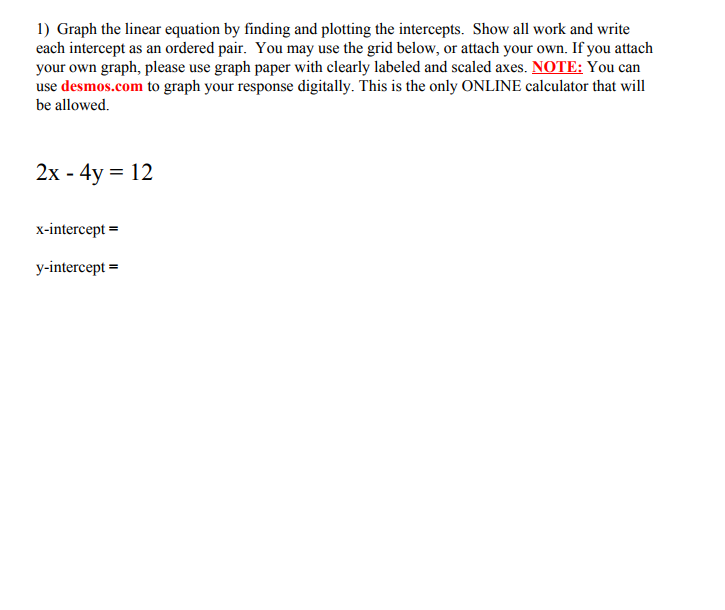
2) Given the line with equation: 3X + 4y 2 24 NOTE: You can use desmosxom to graph your response digitally. This is the only,r DNLINE calculator that will be allowed, :1) Convert the equation to slope-intetoept form. b) State the slope of the line. .'_-'I '1 a .3 ,1 o) State the y-intereept of the line as an ordered pair. d} Uee slope-intercept form to yaph the line- See following page for graphing grid. If you attach your own graph, please use graph paper with clearly labeled and scaled axes. NOTE: You can use deamoe.com to graph your response digitally. This is the only DNLlhlE calculator that will he allowed. 3) Given the points {4, t3] and (B, 9)- a) Find the slope ef the line through the peinte {4, t3) and {3, 9). h) Write the equatien ef the line through the points in paint-elepe Fern], J' ' F. = \"{I ' It} . e) Convert the equation that you mete in part [b] it) Slope-intercept form, J' = 1111' + b . d} Convert the equation that you mete in part [b] te standard form, Ax + By = C , where A, B, and C are integers and A 1' ll e) Graph the line through the two given points. See following page for graphing grid. IF you attach your own graph, please use graph paper with clearly labeled and sealed axes. NOTE: You can use desmos.eom to graph your response digitally. This is the only GNLI'NE calculator that will he allowed. 4) Given a line with equation 51+5J' = 20 . Write an equation in point-slope Form of the line parallel to the given line through the point [2, -3}_ 5) Graph both lines from Question #4 on one coordinate system. You may use the grid below, or attach your own. It'you attach your own graph, please use graph paper with clearly labeled and scaled axes. NTE: You can use desmos.com to graph your response digitally. This is the only DNLINE calculator that will he allowed. e- 11]) In 1964, the United States Surgeon General released a rst report warning ofthe harms eeueetl by smoking. As a health care professional, you are working on e melting-cessation program, and you are studying the table in the table below: Sonree: mrmm.mmmwm_mmbWiLmW.m a) Using the data for 193t} and 2001, write the two data points as ordered pairs, plot them on a clearly labeled and scaled coordinate grid, and draw the lirte through them. You may use the grid below, or attach your own. If you attach your own graph, please use graph paper with clearly labeled and scaled axes. MUTE: 1i'ou can use dcsmas.cam to graph your response digitally. This is the only DNLI'NE calculator that will he allowed. 1"} Determine the slope of the line through the two points you graphed in #6. Write your answer in decimal form, rounded to the nearest hundredth of a percent (ifnecessaryl 3} Explain in a sentence or two the meaning of the slope in the context of the problem. 9A) Write an equation in point-slope form of the line through the two points. QB] Convert the equation to slope-intercept form. 1) Graph the linear equation by nding and plotting the intercepts. Show all work and write each intercept as an ordered pair. You may use the grid below, or attach your own. It'you attach your own graph, please use graph paper with clearly labeled and sealed axes. NQTE: You can use desmos.eon1 to graph your response digitally. This is the only DNLINE calculator that will be allowed. 2x-4y=12 Lit-intercept = y-intereept =