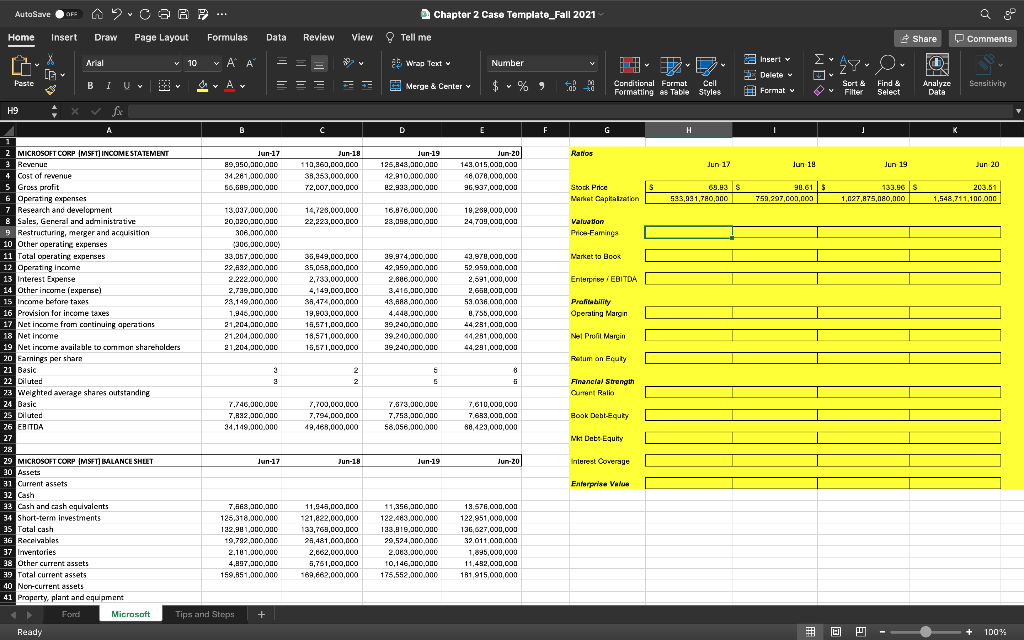
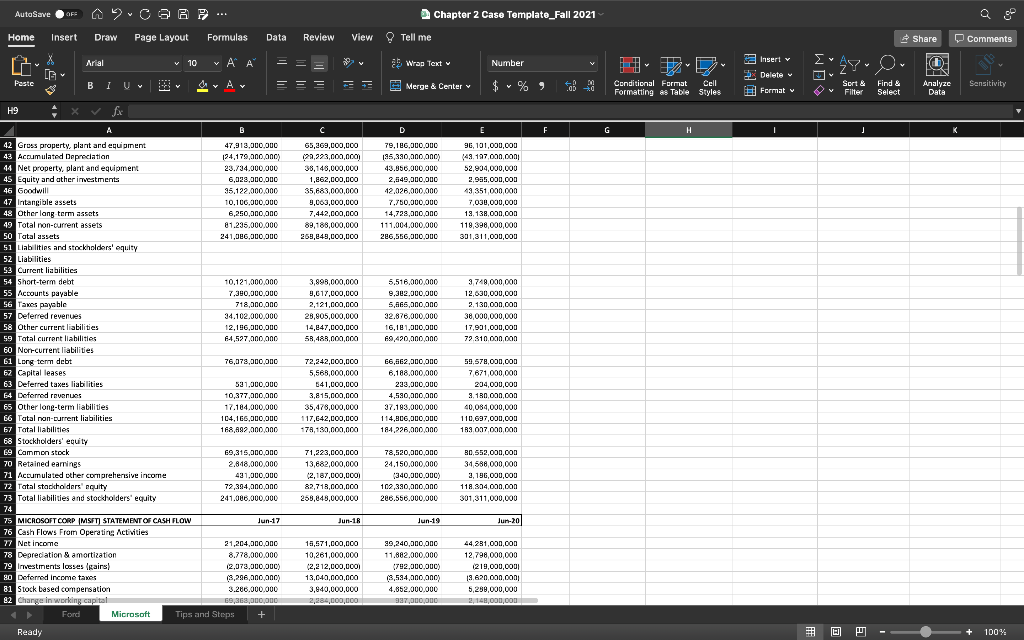
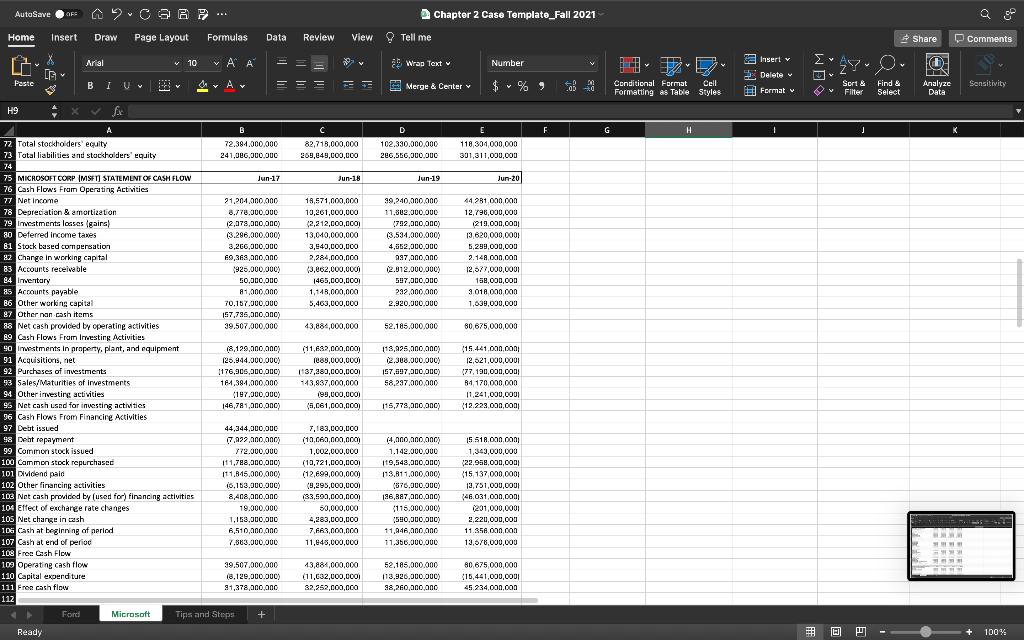
Please show excel cell reference formulas. Thanks 


AutoSave OF C AF... Chapter 2 Case Template_Fall 2021 Tell me Home Insert Draw Page Layout Formulas Data Review View Share Comments Arial X G v 10 v AP Wrap Text Insert v Number Ayo 0 v Delete v Pastc BIU B 1 7 dy Av = = = -- Y Merge & Center $ % Conditional Format Cell Formatting as Table Styles Sensitivity Sort Filter # Format Find & Select Analyze Data V H9 fx A. D E F G . Ratios Jun 17 Jun 19 Jun 19 Jun-18 110,260,000,000 38,353,000,000 72,007,000,000 Jun 20 Jun-19 125,848,000,000 12.910.000.000 82,933.000.000 Jun-20 143,015,000,000 48078,000,000 96,837,000,000 $ Stock Price Market Captamaton 63.93 S 583,93 1,780,000 90.61 $ 759,297,000,000 133.86s 1,027,875,080,000 203.51 1.548,711,100 000 14,728,000,000 22,223,000,000 16.876.000.000 28,098,000,000 18,289,000,000 24,709,000,000 Valuation Prioa-Farring Market to Book Enterprise EBITDA 38,649,000,000 35,058,000,000 2,733,000,000 4,149,000,000 3A,474,000,000 19,603,000,000 18,571,000,000 18,571,000,000 15,671,000,000 29.974.000.000 42,959,000,000 2.886.000.000 3,416,000,000 48,488,000,000 4.448.000.000 99,240,000,000 39.240.000.000 29.240,000,000 43,978,000,000 52,959,000,000 2,591,000,000 2,658,000,000 53.038.00noon 4.755,000,000 44,281,000,000 44 281,000,000 44,291,000,000 Profitability Operating Margin Nel Pront Margin Retum an Eculty 8 5 5 2 2 MICROSOFT CORP (MSFT) INCOME STATEMENT Jun-17 3 Revenue 89,950,000,000 4 cost of revenue 34.281.000.000 5 Gross profit 56,000.00 OPC 6 Operating expenses 7 Research and development 13.037.000.000 8 Sales, General and administrative 20.020,000,000 9 Restructuring, merger and acouisition 306.000.000 10 Other operating expenses (306.000.000) 11 Total Operating expenses 23.057.000.000 12 Operating income 22,822,000,00C 13 Interest Expense 2.222.000.000 14 Other income (expense) 2,799,000,000 15 Income before taxes 23,149,000,000 16 Provision for income taxes 1.940.000.000 17 Net income from continuing aperations 21,204,000,000 18 Net income 21.204.000.000 19 Net income available to common shareholders 21,204.000.000 20 Farnings per share 21 Basic 3 22 Diluted 23 Weighted average shares outstanding 24 Basic 7.746.000.000 25 Diluted 7,892,000,000 26 EBITDA 34.149.000.000 27 28 29 MICROSOFT CORP (MSFT) BALANCE SHEET Jun-17 30 Assets 31 Current assets 32 Cash 33 Cash ard cash equivalents 7,568,000,000 34 Short-term investments 125.318.000.000 35 Total cash 122,98 1,000,000 36 Receivables 19,792,000 ano 37 Inventories 2.101.000.000 38 Other current assets 4,897.000.000 39 Total current assets 159,851.000.000 40 Norrcurrent assets 41 Property, plant and equipment Ford Microsoft Tips and Steps + Ready Financial Strength at Ralio 7,700,000,000 7,734,000,000 49,463,000,000 7.873.000.000 7,753,000,000 58,058.000.000 7,610,000,000 7,633,000,000 88,423,000,000 Book Debt-Equy Mit Date Equity Jun-18 Jun-19 Jun-20 Interest Coverage Enterprise Value 11,945,000,000 121,822,000,000 133,763,000,000 24,481,000,000 2,662,000,000 5,751,000,000 189,662,000,000 11,356,000,000 122.483.000.000 123,919.000.000 29,524 ano ang 2.083.000.000 10,146,000,000 175,552,000,000 12,576,000,000 122.951,000,000 136,627,000,000 32,011,000,oon 1,895,000,000 11,432,000,000 181 915,000,000 + 100% AutoSave OF C AF... Chapter 2 Case Template_Fall 2021 View Tell me Home Insert Draw Page Layout Formulas Data Review Share Comments Arial 10 X X G v v AP Insert v Wrap Text Number Ayo 0 v Delete v Pastc B I U UV 7 dy Av = = = - - Y Merge & Center $ % ) Conditional Format Cell Formatting as Table Styles Sort & Filter # Format Find & Select Sensitivity Analyze Data V H9 fx F G . K 65,269,000,000 129,223,000,000 38,140,000,000 1,862,000,000 35,683,000,000 9,003,000,000 7,442,000,000 89,188,000,000 269,849,000,000 79,186.000.000 135,330,000,000 43.856.000.000 2.149,000,000 12.026.000.000 7.750.000.000 14,728,000,000 111.004.000.000 286,556,000,000 96, 101,000,000 49.197.000.000 52,904,000,000 2,935,000,000 49 351,000,000 7,030,000,000 19.138,000,000 118,398,000,000 301,311,000,000 3,898,000,000 9.617,000,000 2,121,000,000 28,805,000,000 14,847,000,000 58,480.000.000 5.516,000 and 9.383.000.000 5,665,000,000 32.876.000.000 16,181,000,000 69,420,000 and 3,748,000,000 12,630,000,000 2.130,000,000 38,000,000,000 17.931,000,000 72.310.000,oon 42 Gross property, plant and equipment 47,913,000,000 43 Accumulated Depreciatian 124,179,000,000) 44 Net property, plant and equipment 23.734.000.000 45 Equity and ather investments 6,028,000,000 46 Goodwill 35.122.000.000 47 Intangible assets 10,106.000.000 48 Other lang term assets 6,250,000,000 49 Total non-current assets 81.235.000.000 50 Total assets 241,386,500 Oud 51 Liabilities and stockholders' equity 52 Liabilities 53 Current liabilities 54 Short-term debit 10.121.000.000 55 Accounts payable 7.390.000.000 56 Taxes payable 718,000,000 57 Deferred revenues 34.102.000.000 58 Other current liabilities 12,196.000.000 59 Total current liabilities 64,527.000.000 60 Norrcurrent liabilities 61 Long term debt 76,073,000,000 62 Capital leases 63 Deferred taxes liabilities 521.000.000 64 Deferred revenues 10,377.000.000 65 Other long-term liabilities 17.104.000.000 66 Tatal non-current liabilities 104,166.000.000 67 Total liabilities 168,A92.000.000 68 Stockholders' equity Le Cammon stock E9,315,000,000 70 Retained earrings 2.818,000,000 71 Accumulated other comprehensive income 431.000.000 72 Tatal starkholders' Equity 72,394,000,000 73 Total liabilities and stockholders' equity 241.086.000.000 74 75 MICROSOFT CORP |MSFT) STATEMENT OF CASH FLOW Jun-17 76 Cash Flows From Operating Activities 77 Not income 21,204,000,000 78 Depreciation & amortization & 8.778.000.000 79 Investments losses (gains) 12,073,000,000) 80 Deferred income taxes (8.296.000.000) 81 Stock based compensation 3.286.000.000 82 Change in working capital 69,368,000,000 > Ford Microsoft Tips and Steps + Ready 72,242,000,000 5,568,000,000 141,000,000 3,815,000,000 35,478,000,000 117,642,000,000 178,130,000,000 66,662,000,000 6.188.000.000 233.000.000 4,530,000,000 37.183.000.000 114,806,000,000 184.226.000.000 59,578,000,000 7.671,000,000 204,000,000 9.180,000,000 40,084,000,000 110,697,000,000 103.007.00noon 71,223,000,000 13,682,000,000 2,187,000,0001 82,718,000,000 268,848,000,000 78,520,000,000 24.150.000.000 (340,000,000) 102,390,000,000 286.556.000.000 80,552,000,000 34,588,000,000 2,196,000,000 118.804,000,000 301,311,000,000 Jun-18 Jun-19 Jun-20 16,571,000,000 10,261,000,000 12,2 12,000,000 13,040,000,000 3,640,000,000 2,284,000,000 99,240,000,000 11.882.000.000 (792.000.000) (8,534,000,000 4.852.000.000 997,000,000 44.281,000,000 12,798,000,000 1219,000,000 19.620.000,00 5,288,000,000 2,149,000,000 + 100% AutoSave OF A2COA? ... Chapter 2 Case Template_Fall 2021 View Tell me Home Insert Draw Page Layout Formulas Data Review Share 0 Comments Arial 10 X X LA G v v AP Insert v Wrap Text Number 0 X Delete v Pastc B 1 I U UV 7 dy Av Y = = = - - A Merge & Center $ - % % Conditional Format Cell Formatting as Table Styles Sort & Filter # Format Find & Select Analyze Data Sensitivity V H9 fx F G . T 82,718,000,000 269,149,000,000 102.330.000.000 286,566.000.000 118,304,000,000 301,311,000,000 Jun-18 - Jun-19 Jun-20 18,571,000,000 19,261,000,000 (2,212,000,000 13,040,000,000 3,540,000,000 2,284,000,000 (3,662,000,000 1465,000,000 1,148,000,000 5,463,000,000 39.240,000,000 11.842.000.000 (792,000,000) 3.534.000.000) 4,652.000.000 997,000,000 (2.812.000.000) 597,000,000 292,000,000 2.920.000.000 44.281,000,000 12,796,000,000 (219,000,000 13 620.000.000 6,299,000,000 2.149,000,000 12,677,000,0001 158,000,000 9.018,000,000 1,639,000,000 43.084.000.000 52.185.000.000 80,675,000,000 72 Total stockholders' equity 72.384.000.000 73 Total liabilities and stockholders' equity 241.000.000.000 74 75 MICROSOFT CORP (MSFT) STATEMENT OF CASH FLOW Jun-17 76 Cash Flows Fram Operating Activities 77 Net Income 21.204.000.000 78 Depreciation & amortization 8.778.000.000 79 Investments losses (gair) (2,078,000,000) 80 Deferred Income taxes 3.286.000.000) 81 Stock based compensation 3,266.000.000 82 Change in working capital 69,368,000,000 83 Accounts receivable 1926.000.000 94 Inventary 50,000,000 85 Accounts payable 81.000.000 86 Other working capital 70,157.000.000 87 Other nan cash items 157,735,000,000 88 Net cash provided by operating activities 39.507.000.000 89 Cash Flows From Investing Activities 90 Investments in property, plant, and equipment (8,129,000,000) 91 Acquisitions, net 126.944.000.000) 92 Purchases of investments 1176,905,000,000) 93 Sales/Maturities of investments 164.384.000.000 94 Other investing activities (197.000.000) 95 Net cash used for investing activities 146,781,000,000) 96 Cash Flows From Financing Activities 97 Debt issued 44,344,000,000 98 Debt repayment 7.229.000.000) 99 Common stock issued 172.000.000 100 Cammon stock repurchased 111,788,000,000) 101 Dividend paid 111.815.000.000) 102 Other financing activities 16.163.000.000) 103 Net cash provided by used for) financing activities 8,408,000,000 104 Elfect of exchange rate changes 19.000.000 105 Net change in tash 1,153,000,000 106 Cash at beginning of period 6,510,000,000 107 Cash at end of period 7.883.000.000 108 Free Cash Flow 109 Operating cash flow 39.507.000.000 110 Capital expenditure 18,129.000.000) 111 Free cash flow 91,378,000,000 112 Ford Microsoft Tips and Steps + Ready (11,682,000,000 1885,000,0001 1137,380,000,000 143,837,000,000 199,000,000 (8,061,000,000 118,925,000,000) 12.308.000.000) 157.597,000,000) 58.237.000.000 (15.441,000,000 12,621,000,0001 (77,190,000,0001 84 170,000,000 11,241,000,000 (12,223,000,000 115,778,000,000 7,183,000,000 (10,060,000,000 1,002,000,000 (10,721,000,0001 (12,699,000,000 (9,295,000,000 183,500,000,000 50,000,000 4,283,000,000 7,663,000,000 11,648,000,000 14,000,000,000) 1.142.000.00C 119,543,000,000) 113.811.000.000) (676.000.000) 186,887,000,000) (115.000.000) 590.000.000) 11,246.000 and 11.356.000.000 15.510.000,00 1,349,000,000 (22,950,000,000 (15 137,000,0001 12,751,000,000 46,031,000,0001 (201,000,000 2,220,000,000 11.858.000.000 13,678,000,000 19 43,884,000,000 (11,632,000,000 32,252,000,000 52.185.000.000 113,926.000.00C) 98,260,000,000 80 675,000,000 (15,441,000,000 45.234,000,000 , + 100%


