Answered step by step
Verified Expert Solution
Question
1 Approved Answer
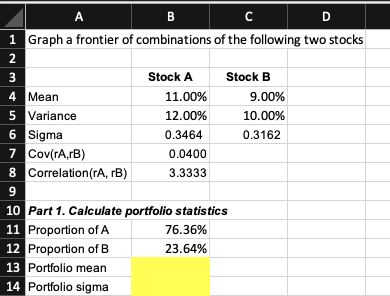
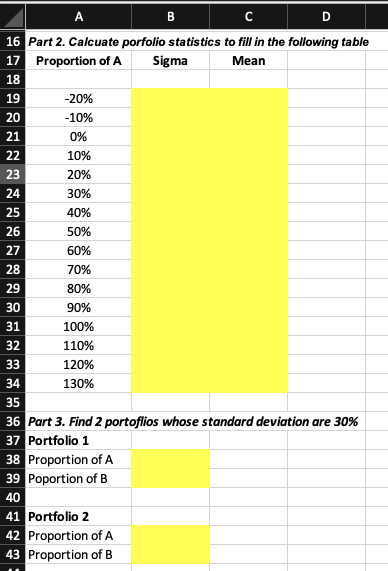
Please show excel Formulas A B C D 1 Graph a frontier of combinations of the following two stocks 3 4 Mean 5 Variance 6


Please show excel Formulas
A B C D 1 Graph a frontier of combinations of the following two stocks 3 4 Mean 5 Variance 6 Sigma 7 Cov(A,B) 8 Correlation(rA, B) Stock A 11.00% 12.00% 0.3464 0.0400 3.3333 Stock B 9.00% 10.00% 0.3162 9 10 Part 1. Calculate portfolio statistics 11 Proportion of A 76.36% 12 Proportion of B 23.64% 13 Portfolio mean 14 Portfolio sigma | A | B | C | D | 16 Part 2. Calcuate porfolio statistics to fill in the following table 17 Proportion of A Sigma Mean | 18 -20% -10% 0% 10% 20% 30% 40% 50% 60% 70% 80% 90% 100% 110% 120% 130% 36 Part 3. Find 2 portoflios whose standard deviation are 30% 37 Portfolio 1 38 Proportion of A 39 Poportion of B | 40 41 Portfolio 2 42 Proportion of A 43 Proportion of B A B C D 1 Graph a frontier of combinations of the following two stocks 3 4 Mean 5 Variance 6 Sigma 7 Cov(A,B) 8 Correlation(rA, B) Stock A 11.00% 12.00% 0.3464 0.0400 3.3333 Stock B 9.00% 10.00% 0.3162 9 10 Part 1. Calculate portfolio statistics 11 Proportion of A 76.36% 12 Proportion of B 23.64% 13 Portfolio mean 14 Portfolio sigma | A | B | C | D | 16 Part 2. Calcuate porfolio statistics to fill in the following table 17 Proportion of A Sigma Mean | 18 -20% -10% 0% 10% 20% 30% 40% 50% 60% 70% 80% 90% 100% 110% 120% 130% 36 Part 3. Find 2 portoflios whose standard deviation are 30% 37 Portfolio 1 38 Proportion of A 39 Poportion of B | 40 41 Portfolio 2 42 Proportion of A 43 Proportion of BStep by Step Solution
There are 3 Steps involved in it
Step: 1

Get Instant Access to Expert-Tailored Solutions
See step-by-step solutions with expert insights and AI powered tools for academic success
Step: 2

Step: 3

Ace Your Homework with AI
Get the answers you need in no time with our AI-driven, step-by-step assistance
Get Started


