

Answered step by step
Verified Expert Solution
Question
1 Approved Answer
Please show excel formulas D H. General Bank of Arcelor- US Steel Means Mittal Microsoft Kellogg Electric Exxon McDonalds Apple America Pfizer 0.0020 0.0037 0.0028
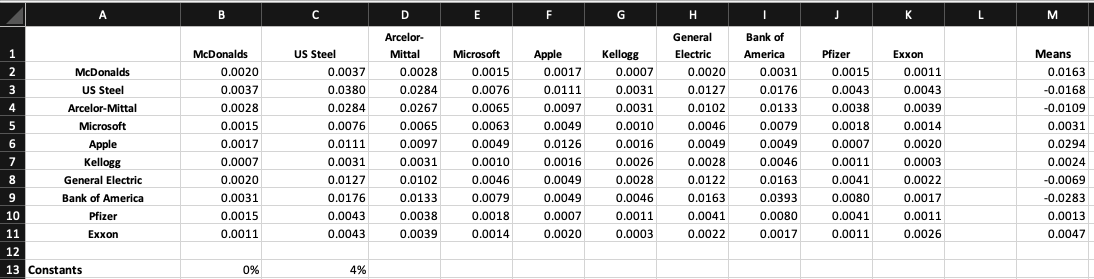
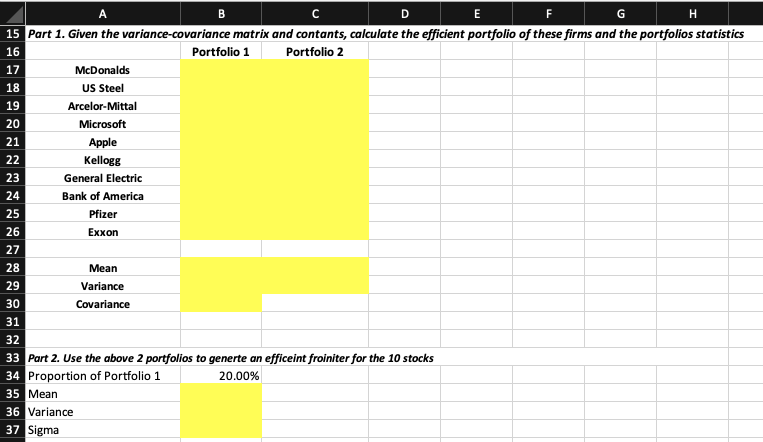
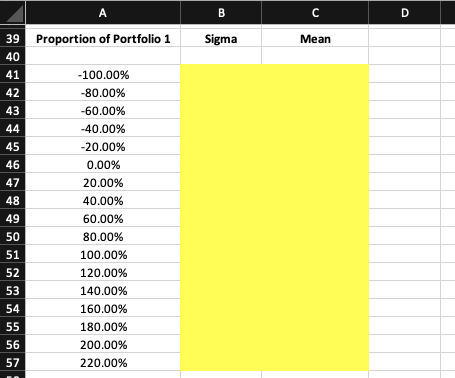
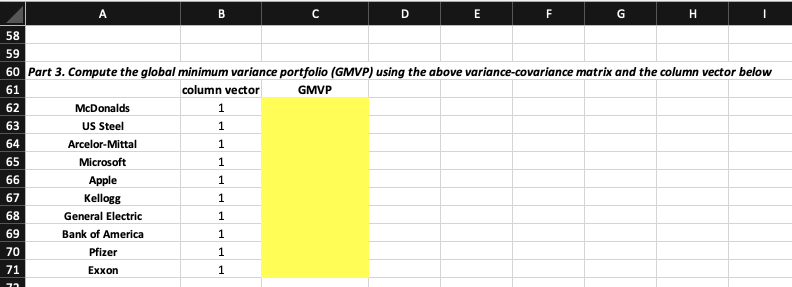
Please show excel formulas
D H. General Bank of Arcelor- US Steel Means Mittal Microsoft Kellogg Electric Exxon McDonalds Apple America Pfizer 0.0020 0.0037 0.0028 0.0015 0.0017 0.0007 0.0020 0.0031 0.0015 0.0011 0.0163 McDonalds US Steel 3 0.0037 0.0380 0.0284 0.0076 0.0031 0.0127 0.0176 0.0043 0.0043 -0.0168 0.0111 4 0.0028 0.0284 0.0267 0.0065 0.0097 0.0031 0.0102 0.0133 0.0038 0.0039 -0.0109 Arcelor-Mittal Microsoft 0.0015 0.0076 0.0065 0.0063 0.0049 0.0010 0.0046 0.0079 0.0018 0.0014 0.0031 6 0.0017 0.0111 0.0097 0.0049 0.0126 0.0016 0.0049 0.0049 0.0007 0.0020 0.0294 Apple 0.0007 0.0031 0.0031 0.0010 0.0016 0.0026 0.0028 0.0046 0.0011 0.0003 0.0024 Kellogg -0.0069 0.0020 0.0127 0.0102 0.0046 0.0049 0.0028 0.0122 0.0163 0.0041 0.0022 General Electric 0.0031 0.0176 0.0133 0.0079 0.0049 0.0046 0.0163 0.0393 0.0080 0.0017 -0.0283 Bank of America 10 Pfizer 0.0015 0.0043 0.0038 0.0018 0.0007 0.0011 0.0041 0.0080 0.0041 0.0011 0.0013 11 0.0011 0.0043 0.0039 0.0014 0.0020 0.0003 0.0022 0.0017 0.0011 0.0026 0.0047 Exxon 12 13 Constants 0% 4% H. 15 Part 1. Given the variance-covariance matrix and contants, calculate the efficient portfolio of these firms and the portfolios statistics 16 Portfolio 1 Portfolio 2 17 McDonalds US Steel 18 19 Arcelor-Mittal 20 Microsoft 21 Apple 22 Kellogg 23 General Electric 24 Bank of America 25 Pfizer 26 Exxon 27 28 Mean 29 Variance 30 Covariance 31 32 33 Part 2. Use the above 2 portfolios to generte an efficeint froiniter for the 10 stocks 34 Proportion of Portfolio 1 20.00% 35 Mean 36 Variance 37 Sigma A 39 Proportion of Portfolio 1 Sigma Mean 40 41 -100.00% 42 -80.00% 43 -60.00% 44 -40.00% 45 -20.00% 46 0.00% 47 20.00% 48 40.00% 49 60.00% 50 80.00% 51 100.00% 52 120.00% 53 140.00% 54 160.00% 55 180.00% 56 200.00% 57 220.00% H. 58 59 60 Part 3. Compute the global minimum variance portfolio (GMVP) using the above variance-covariance matrix and the column vector below 61 column vector GMVP 62 McDonalds US Steel 63 64 Arcelor-Mittal 1. 65 Microsoft 66 Apple 67 Kellogg 68 General Electric 69 Bank of America 70 Pfizer 71 Exxon D H. General Bank of Arcelor- US Steel Means Mittal Microsoft Kellogg Electric Exxon McDonalds Apple America Pfizer 0.0020 0.0037 0.0028 0.0015 0.0017 0.0007 0.0020 0.0031 0.0015 0.0011 0.0163 McDonalds US Steel 3 0.0037 0.0380 0.0284 0.0076 0.0031 0.0127 0.0176 0.0043 0.0043 -0.0168 0.0111 4 0.0028 0.0284 0.0267 0.0065 0.0097 0.0031 0.0102 0.0133 0.0038 0.0039 -0.0109 Arcelor-Mittal Microsoft 0.0015 0.0076 0.0065 0.0063 0.0049 0.0010 0.0046 0.0079 0.0018 0.0014 0.0031 6 0.0017 0.0111 0.0097 0.0049 0.0126 0.0016 0.0049 0.0049 0.0007 0.0020 0.0294 Apple 0.0007 0.0031 0.0031 0.0010 0.0016 0.0026 0.0028 0.0046 0.0011 0.0003 0.0024 Kellogg -0.0069 0.0020 0.0127 0.0102 0.0046 0.0049 0.0028 0.0122 0.0163 0.0041 0.0022 General Electric 0.0031 0.0176 0.0133 0.0079 0.0049 0.0046 0.0163 0.0393 0.0080 0.0017 -0.0283 Bank of America 10 Pfizer 0.0015 0.0043 0.0038 0.0018 0.0007 0.0011 0.0041 0.0080 0.0041 0.0011 0.0013 11 0.0011 0.0043 0.0039 0.0014 0.0020 0.0003 0.0022 0.0017 0.0011 0.0026 0.0047 Exxon 12 13 Constants 0% 4% H. 15 Part 1. Given the variance-covariance matrix and contants, calculate the efficient portfolio of these firms and the portfolios statistics 16 Portfolio 1 Portfolio 2 17 McDonalds US Steel 18 19 Arcelor-Mittal 20 Microsoft 21 Apple 22 Kellogg 23 General Electric 24 Bank of America 25 Pfizer 26 Exxon 27 28 Mean 29 Variance 30 Covariance 31 32 33 Part 2. Use the above 2 portfolios to generte an efficeint froiniter for the 10 stocks 34 Proportion of Portfolio 1 20.00% 35 Mean 36 Variance 37 Sigma A 39 Proportion of Portfolio 1 Sigma Mean 40 41 -100.00% 42 -80.00% 43 -60.00% 44 -40.00% 45 -20.00% 46 0.00% 47 20.00% 48 40.00% 49 60.00% 50 80.00% 51 100.00% 52 120.00% 53 140.00% 54 160.00% 55 180.00% 56 200.00% 57 220.00% H. 58 59 60 Part 3. Compute the global minimum variance portfolio (GMVP) using the above variance-covariance matrix and the column vector below 61 column vector GMVP 62 McDonalds US Steel 63 64 Arcelor-Mittal 1. 65 Microsoft 66 Apple 67 Kellogg 68 General Electric 69 Bank of America 70 Pfizer 71 Exxon
Step by Step Solution
There are 3 Steps involved in it
Step: 1

Get Instant Access to Expert-Tailored Solutions
See step-by-step solutions with expert insights and AI powered tools for academic success
Step: 2

Step: 3
Ace Your Homework with AI
Get the answers you need in no time with our AI-driven, step-by-step assistance
Get Started
Environmental Finance And Investments
Authors: Marc Chesney, Jonathan Gheyssens, Anca Claudia Pana, Luca Taschini
2nd Edition
366248174X, 978-3662481745