Answered step by step
Verified Expert Solution
Link Copied!

Question

1 Approved Answer

Please show explanation The following table presents the speed(in mph) and the stopping distance ( in feet) for a sample of cars. Speed Distance 4

Please show explanation
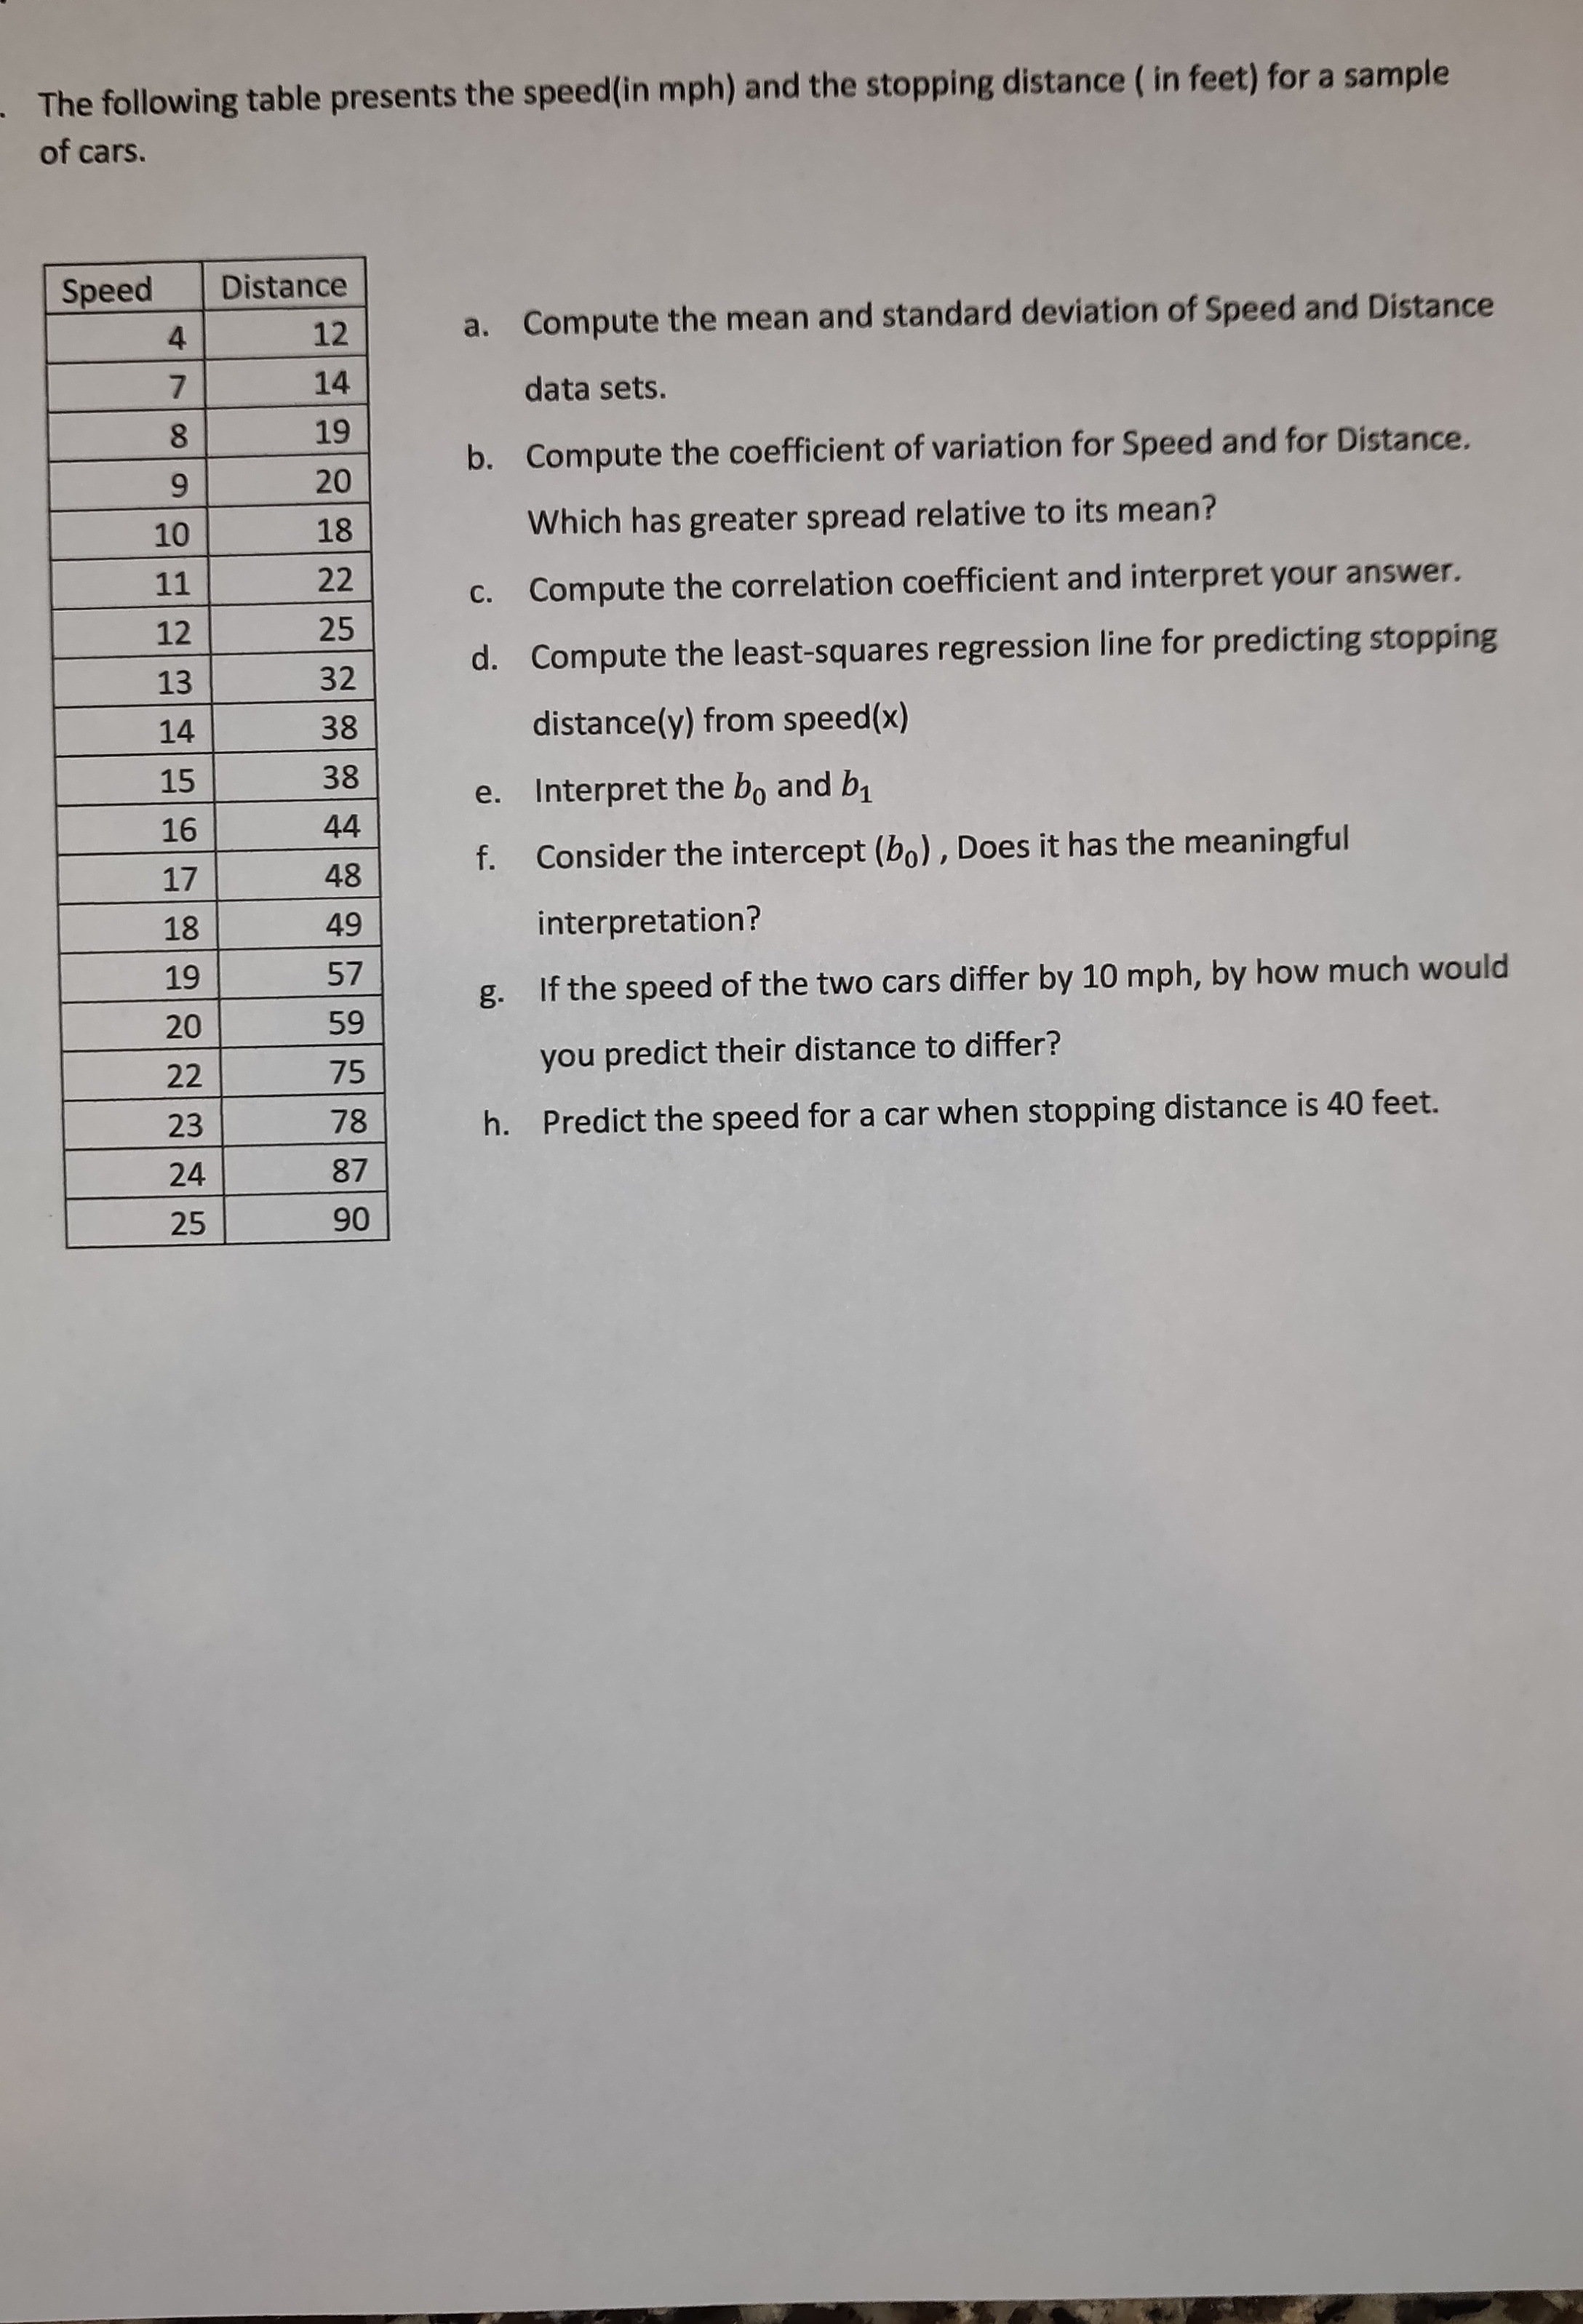
image text in transcribed
The following table presents the speed(in mph) and the stopping distance ( in feet) for a sample of cars. Speed Distance 4 12 a. Compute the mean and standard deviation of Speed and Distance 14 data sets. 8 19 9 20 b. Compute the coefficient of variation for Speed and for Distance. 10 18 Which has greater spread relative to its mean? 11 22 12 25 . Compute the correlation coefficient and interpret your answer. 13 32 d. Compute the least-squares regression line for predicting stopping 14 38 distance(y) from speed(x) 15 38 16 44 e. Interpret the bo and b1 17 48 f. Consider the intercept (bo) , Does it has the meaningful 18 49 interpretation? 19 57 20 59 g. If the speed of the two cars differ by 10 mph, by how much would 22 75 you predict their distance to differ? 23 78 h. Predict the speed for a car when stopping distance is 40 feet. 24 87 25 90

Step by Step Solution

There are 3 Steps involved in it

Step: 1

blur-text-image

Get Instant Access to Expert-Tailored Solutions

See step-by-step solutions with expert insights and AI powered tools for academic success

Step: 2

blur-text-image

Step: 3

blur-text-image

Ace Your Homework with AI

Get the answers you need in no time with our AI-driven, step-by-step assistance

Get Started

Recommended Textbook for

More Books

Students also viewed these Mathematics questions