Please show formula!
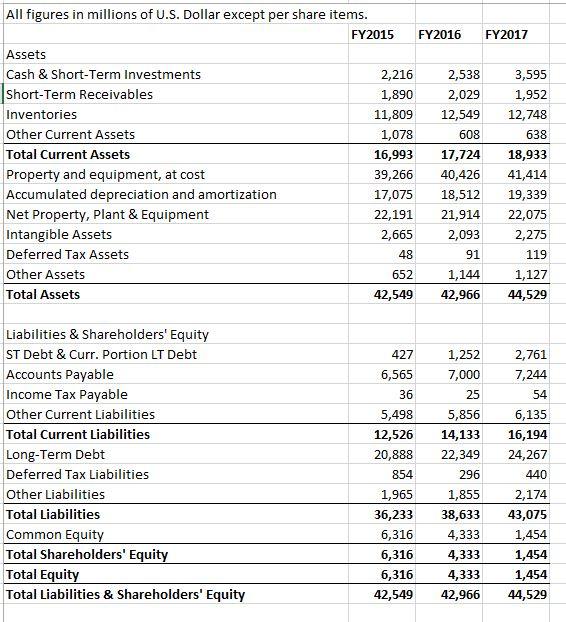
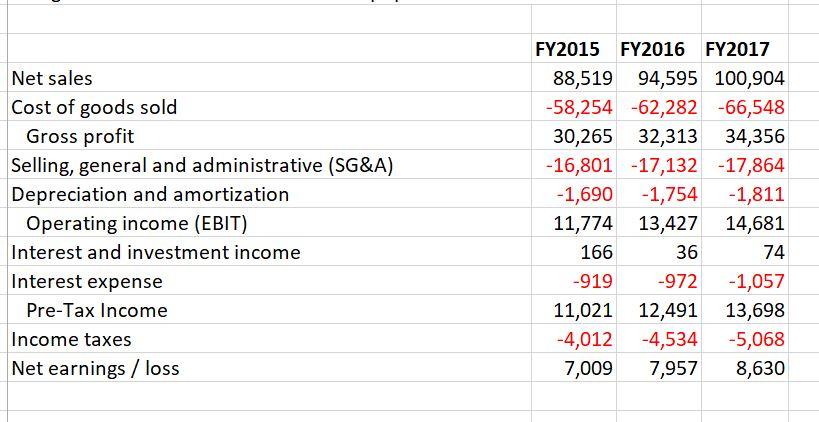
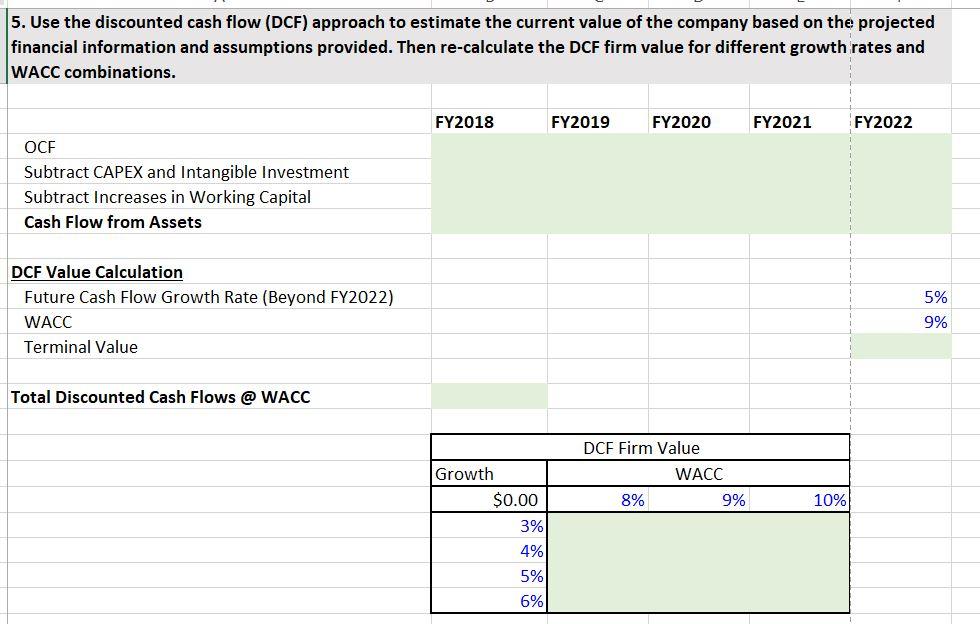
All figures in millions of U.S. Dollar except per share items. FY2015 FY2016 FY2017 Assets Cash & Short-Term Investments 2,216 2,538 3,595 Short-Term Receivables 1,890 2,029 1,952 Inventories 11,809 12,549 12,748 Other Current Assets 1,078 608 638 Total Current Assets 16,993 17,724 18,933 Property and equipment, at cost 39,266 40,426 41,414 Accumulated depreciation and amortization 17,075 18,512 19,339 Net Property, Plant & Equipment 22,191 21,914 22,075 Intangible Assets 2,665 2,093 2,275 Deferred Tax Assets 48 91 119 Other Assets 652 1,144 1,127 Total Assets 42,549 42,966 44,529 427 6,565 36 Liabilities & Shareholders' Equity ST Debt & Curr. Portion LT Debt Accounts Payable Income Tax Payable Other Current Liabilities Total Current Liabilities Long-Term Debt Deferred Tax Liabilities Other Liabilities Total Liabilities Common Equity Total Shareholders' Equity Total Equity Total Liabilities & Shareholders' Equity 5,498 12,526 20,888 854 1,965 36,233 6,316 6,316 6,316 42,549 1,252 7,000 25 5,856 14,133 22,349 296 1,855 38,633 4,333 4,333 4,333 42,966 2,761 7,244 54 6,135 16,194 24,267 440 2,174 43,075 1,454 1,454 1,454 44,529 Net sales Cost of goods sold Gross profit Selling, general and administrative (SG&A) Depreciation and amortization Operating income (EBIT) Interest and investment income Interest expense Pre-Tax Income Income taxes Net earnings / loss FY2015 FY2016 FY2017 88,519 94,595 100,904 -58,254 -62,282 -66,548 30,265 32,313 34,356 -16,801 -17,132 -17,864 -1,690 -1,754 -1,811 11,774 13,427 14,681 166 36 74 -919 -972 -1,057 11,021 12,491 13,698 -4,012 -4,534 -5,068 7,009 7,957 8,630 5. Use the discounted cash flow (DCF) approach to estimate the current value of the company based on the projected financial information and assumptions provided. Then re-calculate the DCF firm value for different growth rates and WACC combinations. FY2018 FY2019 FY2020 FY2021 FY2022 OCF Subtract CAPEX and Intangible Investment Subtract Increases in Working Capital Cash Flow from Assets DCF Value Calculation Future Cash Flow Growth Rate (Beyond FY2022) WACC Terminal Value 5% 9% Total Discounted Cash Flows @ WACC DCF Firm Value WACC 8% 9% 10% Growth $0.00 3% 4% 5% 6% All figures in millions of U.S. Dollar except per share items. FY2015 FY2016 FY2017 Assets Cash & Short-Term Investments 2,216 2,538 3,595 Short-Term Receivables 1,890 2,029 1,952 Inventories 11,809 12,549 12,748 Other Current Assets 1,078 608 638 Total Current Assets 16,993 17,724 18,933 Property and equipment, at cost 39,266 40,426 41,414 Accumulated depreciation and amortization 17,075 18,512 19,339 Net Property, Plant & Equipment 22,191 21,914 22,075 Intangible Assets 2,665 2,093 2,275 Deferred Tax Assets 48 91 119 Other Assets 652 1,144 1,127 Total Assets 42,549 42,966 44,529 427 6,565 36 Liabilities & Shareholders' Equity ST Debt & Curr. Portion LT Debt Accounts Payable Income Tax Payable Other Current Liabilities Total Current Liabilities Long-Term Debt Deferred Tax Liabilities Other Liabilities Total Liabilities Common Equity Total Shareholders' Equity Total Equity Total Liabilities & Shareholders' Equity 5,498 12,526 20,888 854 1,965 36,233 6,316 6,316 6,316 42,549 1,252 7,000 25 5,856 14,133 22,349 296 1,855 38,633 4,333 4,333 4,333 42,966 2,761 7,244 54 6,135 16,194 24,267 440 2,174 43,075 1,454 1,454 1,454 44,529 Net sales Cost of goods sold Gross profit Selling, general and administrative (SG&A) Depreciation and amortization Operating income (EBIT) Interest and investment income Interest expense Pre-Tax Income Income taxes Net earnings / loss FY2015 FY2016 FY2017 88,519 94,595 100,904 -58,254 -62,282 -66,548 30,265 32,313 34,356 -16,801 -17,132 -17,864 -1,690 -1,754 -1,811 11,774 13,427 14,681 166 36 74 -919 -972 -1,057 11,021 12,491 13,698 -4,012 -4,534 -5,068 7,009 7,957 8,630 5. Use the discounted cash flow (DCF) approach to estimate the current value of the company based on the projected financial information and assumptions provided. Then re-calculate the DCF firm value for different growth rates and WACC combinations. FY2018 FY2019 FY2020 FY2021 FY2022 OCF Subtract CAPEX and Intangible Investment Subtract Increases in Working Capital Cash Flow from Assets DCF Value Calculation Future Cash Flow Growth Rate (Beyond FY2022) WACC Terminal Value 5% 9% Total Discounted Cash Flows @ WACC DCF Firm Value WACC 8% 9% 10% Growth $0.00 3% 4% 5% 6%