Answered step by step
Verified Expert Solution
Question
1 Approved Answer
*PLEASE SHOW FORMULAS* FOR REFERENCE: B C D E F G 1 2 3 4 Student instructions: Use the forecasting variables to complete the discounted
*PLEASE SHOW FORMULAS*
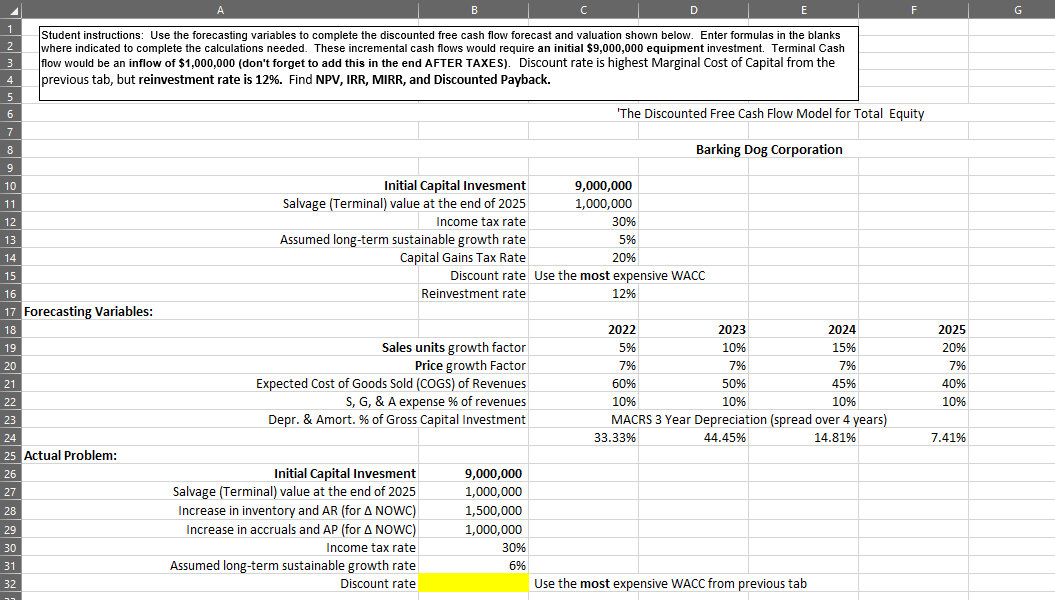
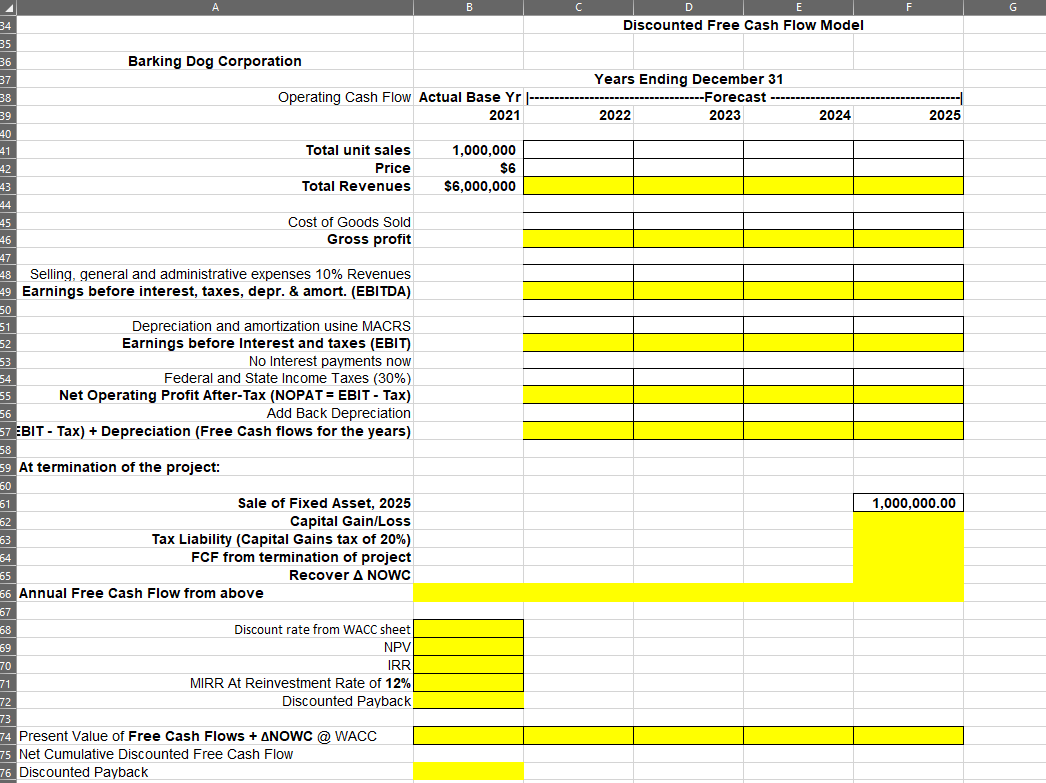
FOR REFERENCE:
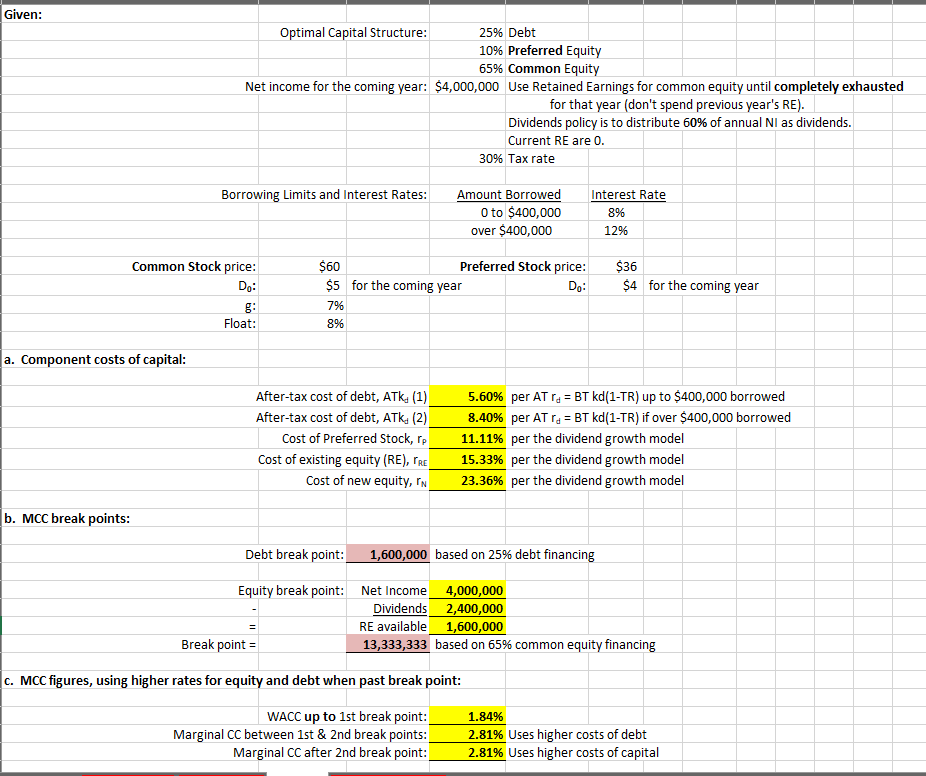
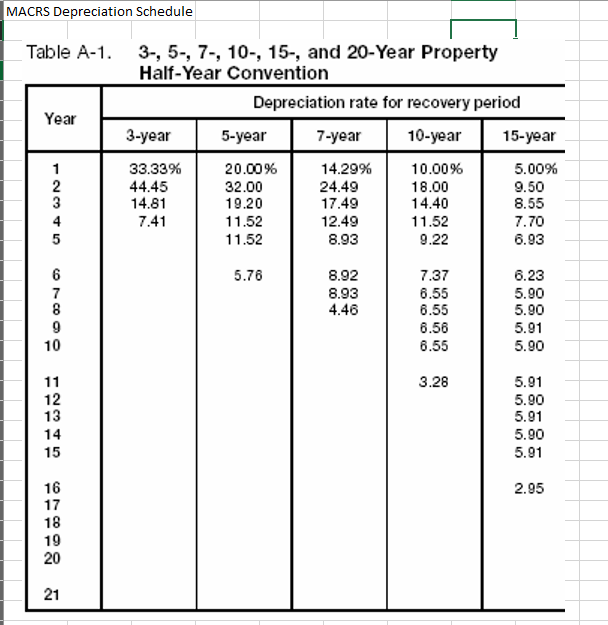
B C D E F G 1 2 3 4 Student instructions: Use the forecasting variables to complete the discounted free cash flow forecast and valuation shown below. Enter formulas in the blanks where indicated to complete the calculations needed. These incremental cash flows would require an initial $9,000,000 equipment investment. Terminal Cash flow would be an inflow of $1,000,000 (don't forget to add this in the end AFTER TAXES). Discount rate is highest Marginal Cost of Capital from the previous tab, but reinvestment rate is 12%. Find NPV, IRR, MIRR, and Discounted Payback. 5 6 'The Discounted Free Cash Flow Model for Total Equity 7 7 8 8 Barking Dog Corporation 9 10 11 12 13 Initial Capital Invesment 9,000,000 Salvage (Terminal) value at the end of 2025 1,000,000 Income tax rate 30% Assumed long-term sustainable growth rate 5% Capital Gains Tax Rate 20% Discount rate Use the most expensive WACC Reinvestment rate 12% 14 15 16 17 Forecasting Variables: 18 19 20 2025 20% 7% 40% Sales units growth factor Price growth Factor Expected Cost of Goods Sold (COGS) of Revenues S, G, & A expense % of revenues Depr. & Amort. % of Gross Capital Investment 21 22 2022 2023 2024 5% 10% 15% 7% 7% 7% 60% 50% % 45% 10% 10% 10% MACRS 3 Year Depreciation (spread over 4 years) 33.33% 44.45% 14.81% 10% 7.41% 23 24 25 Actual Problem: 26 27 28 Initial Capital Invesment Salvage (Terminal) value at the end of 2025 Increase in inventory and AR (for ANOWC) Increase in accruals and AP (for A NOWC) Income tax rate Assumed long-term sustainable growth rate Discount rate 9,000,000 1,000,000 1,500,000 1,000,000 30% 6% 29 30 31 32 Use the most expensive WACC from previous tab B F G E Discounted Free Cash Flow Model Years Ending December 31 --Forecast 2022 2023 2024 2025 43 34 35 36 Barking Dog Corporation 37 38 Operating Cash Flow Actual Base Yr 39 2021 40 41 Total unit sales 1,000,000 42 Price $6 Total Revenues $6,000,000 44 45 Cost of Goods Sold 46 Gross profit 47 48 Selling, general and administrative expenses 10% Revenues 49 Earnings before interest, taxes, depr. & amort. (EBITDA) SO 51 Depreciation and amortization usine MACRS 52 Earnings before Interest and taxes (EBIT) 53 No Interest payments now 54 Federal and State Income Taxes (30%) 55 Net Operating Profit After-Tax (NOPAT = EBIT - Tax) 56 Add Back Depreciation 57 EBIT - Tax) + Depreciation (Free Cash flows for the years) 58 59 At termination of the project: 60 61 Sale of Fixed Asset, 2025 62 Capital Gain/Loss 63 Tax Liability (Capital Gains tax of 20%) 64 FCF from termination of project 65 Recover A NOWC 66 Annual Free Cash Flow from above 67 68 Discount rate from WACC sheet 69 NPV 70 IRR 71 MIRR At Reinvestment Rate of 12% 72 Discounted Payback 73 74 Present Value of Free Cash Flows + ANOWC @ WACC 75 Net Cumulative Discounted Free Cash Flow 76 Discounted Payback 1,000,000.00 Given: Optimal Capital Structure: 25% Debt 10% Preferred Equity 65% Common Equity Net income for the coming year: $4,000,000 Use Retained Earnings for common equity until completely exhausted for that year (don't spend previous year's RE). Dividends policy is to distribute 60% of annual Nl as dividends. Current RE are 0. 30% Tax rate Borrowing Limits and Interest Rates: Amount Borrowed 0 to $400,000 over $400,000 Interest Rate 8% 12% Common Stock price: Do: $60 Preferred Stock price: $5 for the coming year Do: 7% 8% $36 $4 for the coming year Float: a. Component costs of capital: After-tax cost of debt, ATK (1) After-tax cost of debt, ATK (2) Cost of Preferred Stock, rp Cost of existing equity (RE), PRE Cost of new equity, IN 5.60% per AT ra = BT kd(1-TR) up to $400,000 borrowed 8.40% per AT rs = BT kd(1-TR) if over $400,000 borrowed 11.11% per the dividend growth model 15.33% per the dividend growth model 23.36% per the dividend growth model b. MCC break points: Debt break point: 1,600,000 based on 25% debt financing Equity break point: Net Income_4,000,000 Dividends 2,400,000 RE available 1,600,000 Break point = 13,333,333 based on 65% common equity financing = C. MCC figures, using higher rates for equity and debt when past break point: WACC up to 1st break point: Marginal CC between 1st & 2nd break points: Marginal CC after 2nd break point: 1.84% 2.81% Uses higher costs of debt 2.81% Uses higher costs of capital MACRS Depreciation Schedule Table A-1. 3-, 5-, 7-, 10-, 15-, and 20-Year Property Half-Year Convention Depreciation rate for recovery period Year 3-year 5-year 7-year 10-year 15-year 1 33.33% 20.00% 14.29% 10.00% 5.00% 2 44.45 32.00 24.49 18.00 9.50 3 14.81 19.20 17.49 14.40 8.55 4 7.41 11.52 12.49 11.52 7.70 5 11.52 8.93 9.22 6.93 A ON 5.76 6 7 8 9 10 8.92 8.93 4.46 7.37 6.55 6.55 6.56 6.55 6.23 5.90 5.90 5.91 5.90 3.28 11 12 13 14 15 5.91 5.90 5.91 5.90 5.91 HQB HE BTBD 16 17 18 19 20 2.95 21 B C D E F G 1 2 3 4 Student instructions: Use the forecasting variables to complete the discounted free cash flow forecast and valuation shown below. Enter formulas in the blanks where indicated to complete the calculations needed. These incremental cash flows would require an initial $9,000,000 equipment investment. Terminal Cash flow would be an inflow of $1,000,000 (don't forget to add this in the end AFTER TAXES). Discount rate is highest Marginal Cost of Capital from the previous tab, but reinvestment rate is 12%. Find NPV, IRR, MIRR, and Discounted Payback. 5 6 'The Discounted Free Cash Flow Model for Total Equity 7 7 8 8 Barking Dog Corporation 9 10 11 12 13 Initial Capital Invesment 9,000,000 Salvage (Terminal) value at the end of 2025 1,000,000 Income tax rate 30% Assumed long-term sustainable growth rate 5% Capital Gains Tax Rate 20% Discount rate Use the most expensive WACC Reinvestment rate 12% 14 15 16 17 Forecasting Variables: 18 19 20 2025 20% 7% 40% Sales units growth factor Price growth Factor Expected Cost of Goods Sold (COGS) of Revenues S, G, & A expense % of revenues Depr. & Amort. % of Gross Capital Investment 21 22 2022 2023 2024 5% 10% 15% 7% 7% 7% 60% 50% % 45% 10% 10% 10% MACRS 3 Year Depreciation (spread over 4 years) 33.33% 44.45% 14.81% 10% 7.41% 23 24 25 Actual Problem: 26 27 28 Initial Capital Invesment Salvage (Terminal) value at the end of 2025 Increase in inventory and AR (for ANOWC) Increase in accruals and AP (for A NOWC) Income tax rate Assumed long-term sustainable growth rate Discount rate 9,000,000 1,000,000 1,500,000 1,000,000 30% 6% 29 30 31 32 Use the most expensive WACC from previous tab B F G E Discounted Free Cash Flow Model Years Ending December 31 --Forecast 2022 2023 2024 2025 43 34 35 36 Barking Dog Corporation 37 38 Operating Cash Flow Actual Base Yr 39 2021 40 41 Total unit sales 1,000,000 42 Price $6 Total Revenues $6,000,000 44 45 Cost of Goods Sold 46 Gross profit 47 48 Selling, general and administrative expenses 10% Revenues 49 Earnings before interest, taxes, depr. & amort. (EBITDA) SO 51 Depreciation and amortization usine MACRS 52 Earnings before Interest and taxes (EBIT) 53 No Interest payments now 54 Federal and State Income Taxes (30%) 55 Net Operating Profit After-Tax (NOPAT = EBIT - Tax) 56 Add Back Depreciation 57 EBIT - Tax) + Depreciation (Free Cash flows for the years) 58 59 At termination of the project: 60 61 Sale of Fixed Asset, 2025 62 Capital Gain/Loss 63 Tax Liability (Capital Gains tax of 20%) 64 FCF from termination of project 65 Recover A NOWC 66 Annual Free Cash Flow from above 67 68 Discount rate from WACC sheet 69 NPV 70 IRR 71 MIRR At Reinvestment Rate of 12% 72 Discounted Payback 73 74 Present Value of Free Cash Flows + ANOWC @ WACC 75 Net Cumulative Discounted Free Cash Flow 76 Discounted Payback 1,000,000.00 Given: Optimal Capital Structure: 25% Debt 10% Preferred Equity 65% Common Equity Net income for the coming year: $4,000,000 Use Retained Earnings for common equity until completely exhausted for that year (don't spend previous year's RE). Dividends policy is to distribute 60% of annual Nl as dividends. Current RE are 0. 30% Tax rate Borrowing Limits and Interest Rates: Amount Borrowed 0 to $400,000 over $400,000 Interest Rate 8% 12% Common Stock price: Do: $60 Preferred Stock price: $5 for the coming year Do: 7% 8% $36 $4 for the coming year Float: a. Component costs of capital: After-tax cost of debt, ATK (1) After-tax cost of debt, ATK (2) Cost of Preferred Stock, rp Cost of existing equity (RE), PRE Cost of new equity, IN 5.60% per AT ra = BT kd(1-TR) up to $400,000 borrowed 8.40% per AT rs = BT kd(1-TR) if over $400,000 borrowed 11.11% per the dividend growth model 15.33% per the dividend growth model 23.36% per the dividend growth model b. MCC break points: Debt break point: 1,600,000 based on 25% debt financing Equity break point: Net Income_4,000,000 Dividends 2,400,000 RE available 1,600,000 Break point = 13,333,333 based on 65% common equity financing = C. MCC figures, using higher rates for equity and debt when past break point: WACC up to 1st break point: Marginal CC between 1st & 2nd break points: Marginal CC after 2nd break point: 1.84% 2.81% Uses higher costs of debt 2.81% Uses higher costs of capital MACRS Depreciation Schedule Table A-1. 3-, 5-, 7-, 10-, 15-, and 20-Year Property Half-Year Convention Depreciation rate for recovery period Year 3-year 5-year 7-year 10-year 15-year 1 33.33% 20.00% 14.29% 10.00% 5.00% 2 44.45 32.00 24.49 18.00 9.50 3 14.81 19.20 17.49 14.40 8.55 4 7.41 11.52 12.49 11.52 7.70 5 11.52 8.93 9.22 6.93 A ON 5.76 6 7 8 9 10 8.92 8.93 4.46 7.37 6.55 6.55 6.56 6.55 6.23 5.90 5.90 5.91 5.90 3.28 11 12 13 14 15 5.91 5.90 5.91 5.90 5.91 HQB HE BTBD 16 17 18 19 20 2.95 21
Step by Step Solution
There are 3 Steps involved in it
Step: 1

Get Instant Access to Expert-Tailored Solutions
See step-by-step solutions with expert insights and AI powered tools for academic success
Step: 2

Step: 3

Ace Your Homework with AI
Get the answers you need in no time with our AI-driven, step-by-step assistance
Get Started


