PLEASE SHOW HOW TO SOLVE USING EXCEL, PLEASE INCLUDE ALL FORMULAS USING FOR EXAMPLE: =PV(C42,C41.C40,0,0)
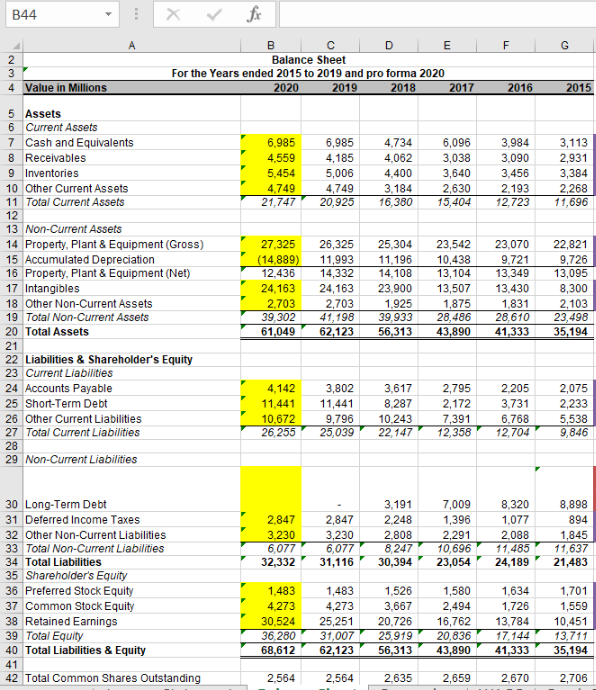
IVE INCLUDED THE DATA (BALANCE SHEET) NEEDED TO SOLVE FOR THE REGRESSION.
DATA:
REGRESSION NEED TO SOLVE
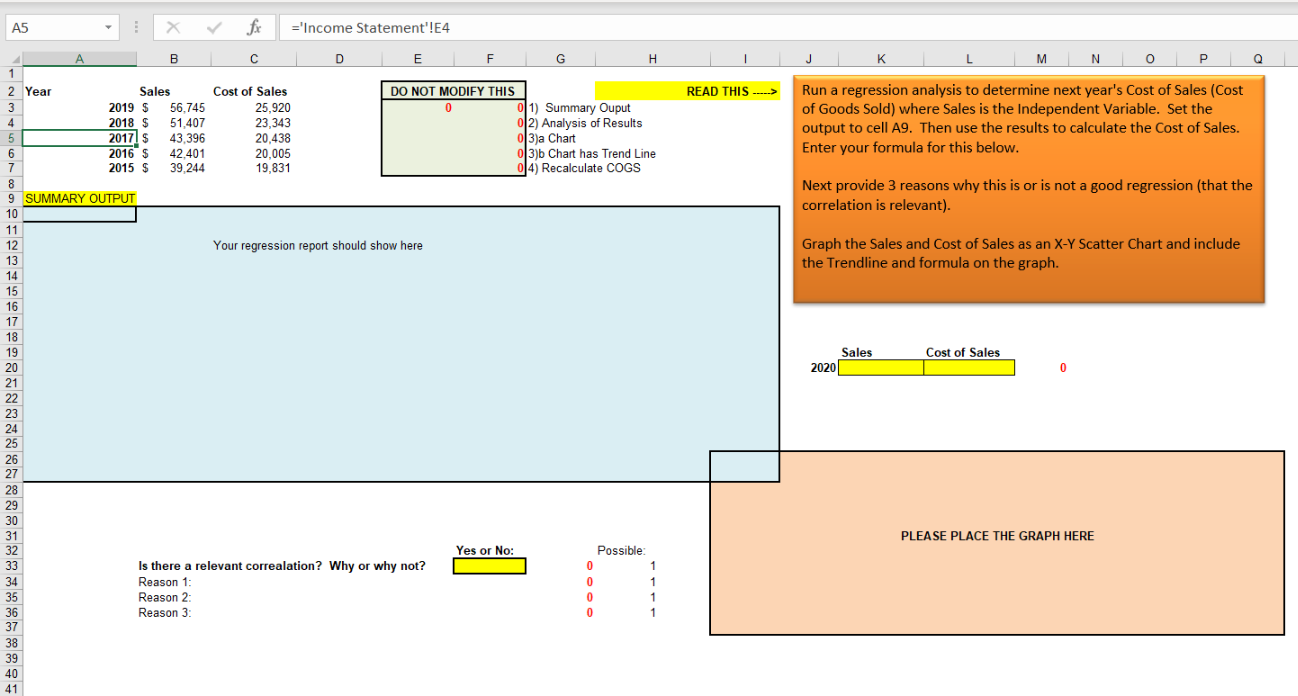
B44 fx F G 2016 2015 3,984 3,090 3,456 2,193 12.723 3,113 2,931 3,384 2,268 11,696 B E 2 Balance Sheet 3 For the Years ended 2015 to 2019 and pro forma 2020 4 Value in Millions 2020 2019 2018 2017 5 Assets 6 Current Assets 7 Cash and Equivalents 6,985 6,985 4.734 6,096 8 Receivables 4,559 4,185 4,062 3,038 9 Inventories 5,454 5,006 4,400 3,640 10 Other Current Assets 4,749 4,749 3.184 2,630 11 Total Current Assets 21.747 20,925 16,380 15,404 12 13 Non-Current Assets 14 Property, Plant & Equipment (Gross) 27,325 26,325 25,304 23,542 15 Accumulated Depreciation (14,889) 11,993 11.196 10,438 16 Property, Plant & Equipment (Net) 12,436 14,332 14,108 13,104 17 Intangibles 24.163 24,163 23,900 13,507 18 Other Non-Current Assets 2.703 2,703 1.925 1,875 19 Total Non-Current Assets 39, 302 41,198 39.933 28,486 20 Total Assets 61,049 62,123 56,313 43,890 21 22 Liabilities & Shareholder's Equity 23 Current Liabilities 24 Accounts Payable 4.142 3,802 3,617 2,795 25 Short-Term Debt 11,441 11,441 8,287 2,172 26 Other Current Liabilities 10.672 9,796 10.243 7,391 27 Total Current Liabilities 26,255 25,039 22,147 12,358 28 29 Non-Current Liabilities 23,070 9,721 13,349 13,430 1,831 28,610 41,333 22,821 9,726 13,095 8,300 2,103 23,498 35,194 2.205 3,731 6.768 12,704 2,075 2,233 5,538 9,846 2.847 3.230 6,077 32,332 2,847 3,230 6,077 31,116 3,191 2.248 2.808 8,247 30,394 7,009 1,396 2,291 10,696 23,054 8,320 1,077 2.088 11,485 24.189 8,898 894 1,845 11,637 21,483 30 Long-Term Debt 31 Deferred Income Taxes 32 Other Non-Current Liabilities 33 Total Non-Current Liabilities 34 Total Liabilities 35 Shareholder's Equity 36 Preferred Stock Equity 37 Common Stock Equity 38 Retained Earnings 39 Total Equity 40 Total Liabilities & Equity 41 42 Total Common Shares Outstanding 1,483 4,273 30,524 36,280 68,612 1,483 4,273 25,251 31,007 62,123 1,526 3,667 20,726 25,919 56,313 1,580 2,494 16,762 20,836 43,890 1,634 1,726 13,784 17,144 41,333 1,701 1,559 10,451 13,711 35,194 2.564 2,564 2.635 2,659 2.670 2,706 A5 ='Income Statement'!E4 A B D E F G H M N 0 Q 1 READ THIS --> Run a regression analysis to determine next year's Cost of Sales (Cost of Goods Sold) where Sales is the Independent Variable. Set the output to cell A9. Then use the results to calculate the cost of Sales. Enter your formula for this below. Next provide 3 reasons why this is or is not a good regression (that the correlation is relevant). Graph the Sales and Cost of Sales as an X-Y Scatter Chart and include the Trendline and formula on the graph. Sales Cost of Sales 2020 0 2 Year Sales Cost of Sales DO NOT MODIFY THIS 3 2019 $ 56,745 25.920 0 1) Summary Ouput 4 2018 $ 51.407 23.343 012) Analysis of Results 5 20171 $ 43.396 20.438 03)a Chart 6 2016 $ 42.401 20.005 0|3)b Chart has Trend Line 7 2015 $ 39,244 19,831 14) Recalculate COGS 8 9 SUMMARY OUTPUT 10 11 12 Your regression report should show here 13 14 15 16 17 18 19 20 21 22 23 24 25 26 27 28 29 30 31 32 Yes or No: Possible: 33 Is there a relevant correalation? Why or why not? 0 1 34 Reason 1: 0 35 Reason 2 0 36 Reason 3 0 1 37 38 39 40 41 PLEASE PLACE THE GRAPH HERE 1 1 B44 fx F G 2016 2015 3,984 3,090 3,456 2,193 12.723 3,113 2,931 3,384 2,268 11,696 B E 2 Balance Sheet 3 For the Years ended 2015 to 2019 and pro forma 2020 4 Value in Millions 2020 2019 2018 2017 5 Assets 6 Current Assets 7 Cash and Equivalents 6,985 6,985 4.734 6,096 8 Receivables 4,559 4,185 4,062 3,038 9 Inventories 5,454 5,006 4,400 3,640 10 Other Current Assets 4,749 4,749 3.184 2,630 11 Total Current Assets 21.747 20,925 16,380 15,404 12 13 Non-Current Assets 14 Property, Plant & Equipment (Gross) 27,325 26,325 25,304 23,542 15 Accumulated Depreciation (14,889) 11,993 11.196 10,438 16 Property, Plant & Equipment (Net) 12,436 14,332 14,108 13,104 17 Intangibles 24.163 24,163 23,900 13,507 18 Other Non-Current Assets 2.703 2,703 1.925 1,875 19 Total Non-Current Assets 39, 302 41,198 39.933 28,486 20 Total Assets 61,049 62,123 56,313 43,890 21 22 Liabilities & Shareholder's Equity 23 Current Liabilities 24 Accounts Payable 4.142 3,802 3,617 2,795 25 Short-Term Debt 11,441 11,441 8,287 2,172 26 Other Current Liabilities 10.672 9,796 10.243 7,391 27 Total Current Liabilities 26,255 25,039 22,147 12,358 28 29 Non-Current Liabilities 23,070 9,721 13,349 13,430 1,831 28,610 41,333 22,821 9,726 13,095 8,300 2,103 23,498 35,194 2.205 3,731 6.768 12,704 2,075 2,233 5,538 9,846 2.847 3.230 6,077 32,332 2,847 3,230 6,077 31,116 3,191 2.248 2.808 8,247 30,394 7,009 1,396 2,291 10,696 23,054 8,320 1,077 2.088 11,485 24.189 8,898 894 1,845 11,637 21,483 30 Long-Term Debt 31 Deferred Income Taxes 32 Other Non-Current Liabilities 33 Total Non-Current Liabilities 34 Total Liabilities 35 Shareholder's Equity 36 Preferred Stock Equity 37 Common Stock Equity 38 Retained Earnings 39 Total Equity 40 Total Liabilities & Equity 41 42 Total Common Shares Outstanding 1,483 4,273 30,524 36,280 68,612 1,483 4,273 25,251 31,007 62,123 1,526 3,667 20,726 25,919 56,313 1,580 2,494 16,762 20,836 43,890 1,634 1,726 13,784 17,144 41,333 1,701 1,559 10,451 13,711 35,194 2.564 2,564 2.635 2,659 2.670 2,706 A5 ='Income Statement'!E4 A B D E F G H M N 0 Q 1 READ THIS --> Run a regression analysis to determine next year's Cost of Sales (Cost of Goods Sold) where Sales is the Independent Variable. Set the output to cell A9. Then use the results to calculate the cost of Sales. Enter your formula for this below. Next provide 3 reasons why this is or is not a good regression (that the correlation is relevant). Graph the Sales and Cost of Sales as an X-Y Scatter Chart and include the Trendline and formula on the graph. Sales Cost of Sales 2020 0 2 Year Sales Cost of Sales DO NOT MODIFY THIS 3 2019 $ 56,745 25.920 0 1) Summary Ouput 4 2018 $ 51.407 23.343 012) Analysis of Results 5 20171 $ 43.396 20.438 03)a Chart 6 2016 $ 42.401 20.005 0|3)b Chart has Trend Line 7 2015 $ 39,244 19,831 14) Recalculate COGS 8 9 SUMMARY OUTPUT 10 11 12 Your regression report should show here 13 14 15 16 17 18 19 20 21 22 23 24 25 26 27 28 29 30 31 32 Yes or No: Possible: 33 Is there a relevant correalation? Why or why not? 0 1 34 Reason 1: 0 35 Reason 2 0 36 Reason 3 0 1 37 38 39 40 41 PLEASE PLACE THE GRAPH HERE 1 1