Answered step by step
Verified Expert Solution
Question
1 Approved Answer
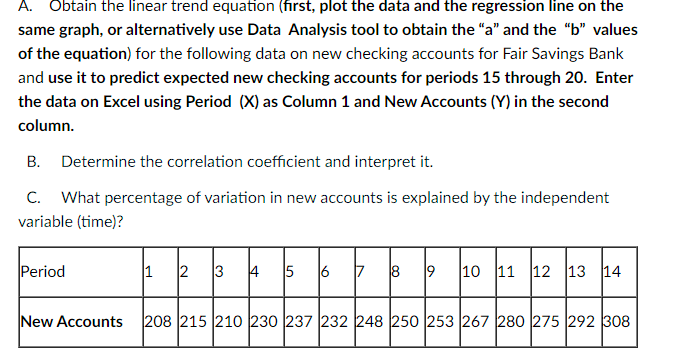
Please show in excel with formulas that you used. I have already figured out B&C but I cannot figure out how to find periods 15-20

Please show in excel with formulas that you used. I have already figured out B&C but I cannot figure out how to find periods 15-20
A. Obtain the linear trend equation ( first, plot the data and the regression line on the same graph, or alternatively use Data Analysis tool to obtain the "a" and the "b" values of the equation) for the following data on new checking accounts for Fair Savings Bank and use it to predict expected new checking accounts for periods 15 through 20. Enter the data on Excel using Period (X) as Column 1 and New Accounts (Y) in the second column. B. Determine the correlation coefficient and interpret it. C. What percentage of variation in new accounts is explained by the independent variable (time)Step by Step Solution
There are 3 Steps involved in it
Step: 1

Get Instant Access to Expert-Tailored Solutions
See step-by-step solutions with expert insights and AI powered tools for academic success
Step: 2

Step: 3

Ace Your Homework with AI
Get the answers you need in no time with our AI-driven, step-by-step assistance
Get Started


