

Question
please show MATLAB script. thanks! Note: Idealprop interpolates and outputs air properties that follow the ideal gas law given an input value you need matlab
please show MATLAB script. thanks!
Note: Idealprop interpolates and outputs air properties that follow the ideal gas law given an input value
you need matlab to answer this question
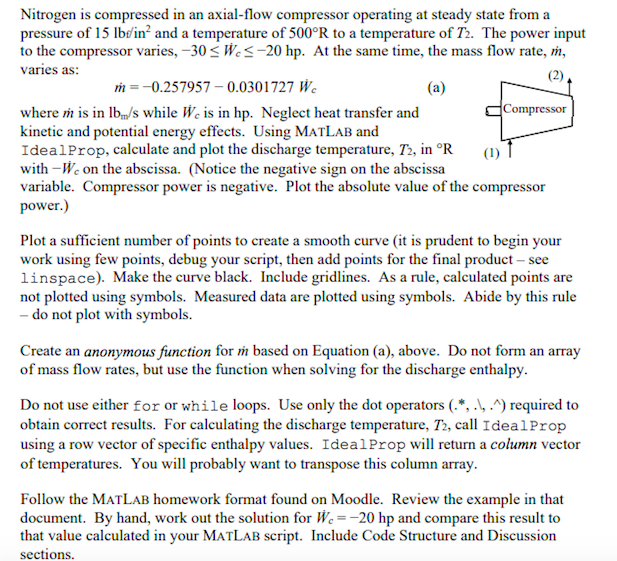
Nitrogen is compressed in an axial-flow compressor operating at steady state from a pressure of 15 lb in and a temperature of 500R to a temperature of T2. The power input to the compressor varies, -30W -20 hp. At the same time, the mass flow rate, m, varies as: m= -0.257957 -0.0301727 W where is in lb/s while W is in hp. Neglect heat transfer and Compressor kinetic and potential energy effects. Using MATLAB and IdealProp, calculate and plot the discharge temperature, T2, in R (1) 1 with-W on the abscissa. (Notice the negative sign on the abscissa variable. Compressor power is negative. Plot the absolute value of the compressor power.) Plot a sufficient number of points to create a smooth curve (it is prudent to begin your work using few points, debug your script, then add points for the final product - see linspace). Make the curve black. Include gridlines. As a rule, calculated points are not plotted using symbols. Measured data are plotted using symbols. Abide by this rule - do not plot with symbols. Create an anonymous function for m based on Equation (a), above. Do not form an array of mass flow rates, but use the function when solving for the discharge enthalpy. Do not use either for or while loops. Use only the dot operators (*,.,.) required to obtain correct results. For calculating the discharge temperature, T2, call Ideal Prop using a row vector of specific enthalpy values. Ideal Prop will return a column vector of temperatures. You will probably want to transpose this column array. Follow the MATLAB homework format found on Moodle. Review the example in that document. By hand, work out the solution for W=-20 hp and compare this result to that value calculated in your MATLAB script. Include Code Structure and Discussion sections. Nitrogen is compressed in an axial-flow compressor operating at steady state from a pressure of 15 lb in and a temperature of 500R to a temperature of T2. The power input to the compressor varies, -30W -20 hp. At the same time, the mass flow rate, m, varies as: m= -0.257957 -0.0301727 W where is in lb/s while W is in hp. Neglect heat transfer and Compressor kinetic and potential energy effects. Using MATLAB and IdealProp, calculate and plot the discharge temperature, T2, in R (1) 1 with-W on the abscissa. (Notice the negative sign on the abscissa variable. Compressor power is negative. Plot the absolute value of the compressor power.) Plot a sufficient number of points to create a smooth curve (it is prudent to begin your work using few points, debug your script, then add points for the final product - see linspace). Make the curve black. Include gridlines. As a rule, calculated points are not plotted using symbols. Measured data are plotted using symbols. Abide by this rule - do not plot with symbols. Create an anonymous function for m based on Equation (a), above. Do not form an array of mass flow rates, but use the function when solving for the discharge enthalpy. Do not use either for or while loops. Use only the dot operators (*,.,.) required to obtain correct results. For calculating the discharge temperature, T2, call Ideal Prop using a row vector of specific enthalpy values. Ideal Prop will return a column vector of temperatures. You will probably want to transpose this column array. Follow the MATLAB homework format found on Moodle. Review the example in that document. By hand, work out the solution for W=-20 hp and compare this result to that value calculated in your MATLAB script. Include Code Structure and Discussion sections
Step by Step Solution
There are 3 Steps involved in it
Step: 1

Get Instant Access to Expert-Tailored Solutions
See step-by-step solutions with expert insights and AI powered tools for academic success
Step: 2

Step: 3
Ace Your Homework with AI
Get the answers you need in no time with our AI-driven, step-by-step assistance
Get Started
Transactions On Large Scale Data And Knowledge Centered Systems Xxxviii Special Issue On Database And Expert Systems Applications Lncs 11250
Authors: Abdelkader Hameurlain ,Roland Wagner ,Sven Hartmann ,Hui Ma
1st Edition
3662583836, 978-3662583838