

Answered step by step
Verified Expert Solution
Question
1 Approved Answer
please show me the excell,how to Intro The following table shows historical end-of-year prices for a stock and the S&P 500, as well as the
please show me the excell,how to 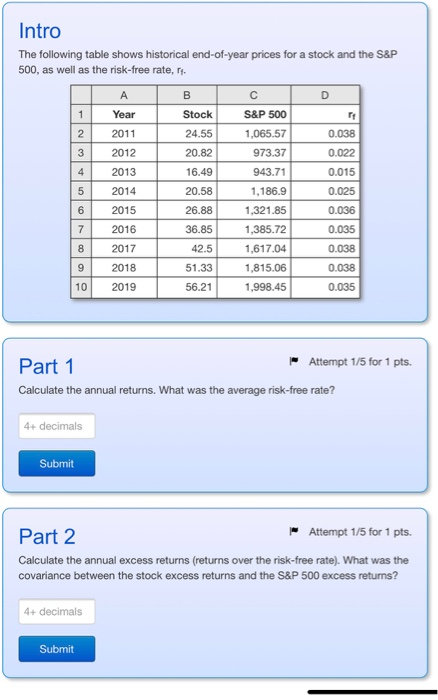 Intro The following table shows historical end-of-year prices for a stock and the S&P 500, as well as the risk-free rate, r 1 Year 2 2011 3 2012 4 2013 2014 6 2015 7 2016 8 2017 9 2018 10 2019 Stock 24.55 20.82 16.49 20.58 26.88 36.85 42.5 51.33 56.21 S&P 500 1,065.57 973.37 943.71 1,186.9 1,321.85 1,385.72 1,617.04 1,815.06 1,998.45 0.038 0.022 0.015 0.025 0.036 0.035 0.038 0.038 0.035 Part 1 Calculate the annual returns. What was the average risk-free rate? Attempt 1/5 for 1 pts. 4+ decimals Submit Attempt 1/5 for 1 pts Part 2 Calculate the annual excess returns (returns over the risk-free rate). What was the covariance between the stock excess returns and the S&P 500 excess returns? 4+ decimals Submit
Step by Step Solution
There are 3 Steps involved in it
Step: 1

Get Instant Access to Expert-Tailored Solutions
See step-by-step solutions with expert insights and AI powered tools for academic success
Step: 2

Step: 3
Ace Your Homework with AI
Get the answers you need in no time with our AI-driven, step-by-step assistance
Get Started
Quantum Investing Unlocking The Secrets Of The New Financial System
Authors: Hugh Webb
1st Edition
979-8388948823