Answered step by step
Verified Expert Solution
Question
1 Approved Answer
Please show salution From the following data related to sales of products A, B and C. Find the trend values and forecast the sales for
Please show salution
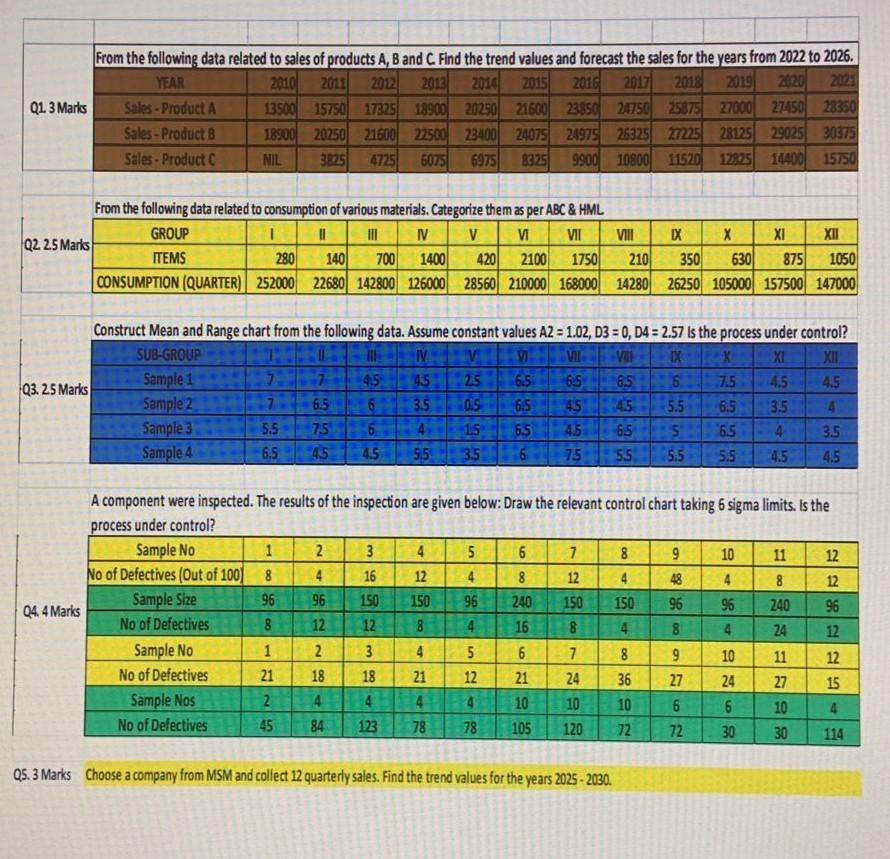
From the following data related to sales of products A, B and C. Find the trend values and forecast the sales for the years from 2022 to 2026. YEAR 2010 2011 2012 2013 2014 2015 2016 2017 2018 2019 2020 2021 Q1. 3 Marks Sales - Product A 13500 15750 17325 1890020250 21600 23850 24750 25875 27000 2745028350 Sales - Product B 18900 20250 21600 22500 23400 24075 2497526325 2725 28125 29025 30375 Sales - Product NIL 3825 4725 6075 6975 8325 9900 10800 11520 12825 14400) 15750 VIII From the following data related to consumption of various materials. Categorize them as per ABC & HML GROUP 1 III IV V VII EX XI XII Q2 25 Marks ITEMS 280 700 1400 2100 1750 210) 350 630 875 1050 CONSUMPTION (QUARTER) 252000 22680 142800 126000 28560 210000 168000 14280 26250 105000 157500 147000 140 420 Q3.25 Marks Construct Mean and Range chart from the following data. Assume constant values A2 = 1.02, D3 = 0, D4 = 2.57 is the process under control? SUB-GROUP III IV V V VI VII IX X XI XII Sample 1 45 45 25 65 65 65 6 7.5 Sample 2 6.5 6 3.5 0.5 6.5 45 45 5.5 3.5 4 Sample 3 5.5 75 6 4 15 65 45 65 5 6.5 4 3.5 Sample 4 6.5:45 45 95 35 6 75 55 5.5 4.5 4.5 4.5 6.5 int 5.5 4.5 4 en GO 150 A component were inspected. The results of the inspection are given below: Draw the relevant control chart taking 6 sigma limits. Is the process under control? Sample No 1 2 3 4 5 6 7 8 10 11 12 No of Defectives (Out of 100% 8 4 16 12 4 8 12 48 4 8 12 Sample Size 96 96 150 96 240 150 150 96 96 240 96 04.4 Marks No of Defectives 8 12 12 8 4 16 8 4 24 12 Sample No 1 2 3 4 5 6 7 10 11 12 No of Defectives 21 18 18 21 12 21 24 36 27 24 27 15 Sample Nos 2 4 4 4 4 10 10 10 6 6 10 4 No of Defectives 45 84 123 78 78 105 120 72 30 30 114 RO 00 cooo8810 72 Q5. 3 Marks Choose a company from MSM and collect 12 quarterly sales. Find the trend values for the years 2025 - 2030. N VE S S U S From the following data related to sales of products A, B and C. Find the trend values and forecast the sales for the years from 2022 to 2026. YEAR 2010 2011 2012 2013 2014 2015 2016 2017 2018 2019 2020 2021 Q1. 3 Marks Sales - Product A 13500 15750 17325 1890020250 21600 23850 24750 25875 27000 2745028350 Sales - Product B 18900 20250 21600 22500 23400 24075 2497526325 2725 28125 29025 30375 Sales - Product NIL 3825 4725 6075 6975 8325 9900 10800 11520 12825 14400) 15750 VIII From the following data related to consumption of various materials. Categorize them as per ABC & HML GROUP 1 III IV V VII EX XI XII Q2 25 Marks ITEMS 280 700 1400 2100 1750 210) 350 630 875 1050 CONSUMPTION (QUARTER) 252000 22680 142800 126000 28560 210000 168000 14280 26250 105000 157500 147000 140 420 Q3.25 Marks Construct Mean and Range chart from the following data. Assume constant values A2 = 1.02, D3 = 0, D4 = 2.57 is the process under control? SUB-GROUP III IV V V VI VII IX X XI XII Sample 1 45 45 25 65 65 65 6 7.5 Sample 2 6.5 6 3.5 0.5 6.5 45 45 5.5 3.5 4 Sample 3 5.5 75 6 4 15 65 45 65 5 6.5 4 3.5 Sample 4 6.5:45 45 95 35 6 75 55 5.5 4.5 4.5 4.5 6.5 int 5.5 4.5 4 en GO 150 A component were inspected. The results of the inspection are given below: Draw the relevant control chart taking 6 sigma limits. Is the process under control? Sample No 1 2 3 4 5 6 7 8 10 11 12 No of Defectives (Out of 100% 8 4 16 12 4 8 12 48 4 8 12 Sample Size 96 96 150 96 240 150 150 96 96 240 96 04.4 Marks No of Defectives 8 12 12 8 4 16 8 4 24 12 Sample No 1 2 3 4 5 6 7 10 11 12 No of Defectives 21 18 18 21 12 21 24 36 27 24 27 15 Sample Nos 2 4 4 4 4 10 10 10 6 6 10 4 No of Defectives 45 84 123 78 78 105 120 72 30 30 114 RO 00 cooo8810 72 Q5. 3 Marks Choose a company from MSM and collect 12 quarterly sales. Find the trend values for the years 2025 - 2030. N VE S S U SStep by Step Solution
There are 3 Steps involved in it
Step: 1

Get Instant Access to Expert-Tailored Solutions
See step-by-step solutions with expert insights and AI powered tools for academic success
Step: 2

Step: 3
Ace Your Homework with AI
Get the answers you need in no time with our AI-driven, step-by-step assistance
Get Started