Answered step by step
Verified Expert Solution
Link Copied!

Question

1 Approved Answer

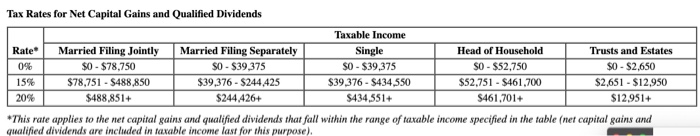
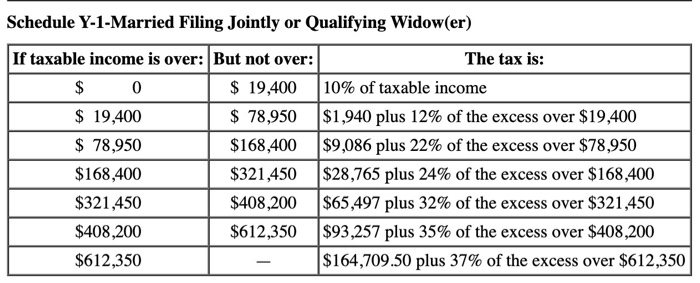
please show step by step and this is related to tax accounting. (The following information applies to the questions displayed below.) During the current year,

please show step by step and this is related to tax accounting. image text in transcribed
image text in transcribed
(The following information applies to the questions displayed below.) During the current year, Ron and Anne sold the following assets: (Use the dividends and capital gains tax rates and tax rate schedules.) Capital Asset L stock M stock N stock O stock Antiques Rental home Market Value $ 54,400 32,400 34,400 30,400 11,400 304,400* Tax Basis $43, 200 41,200 24, 200 35,200 6, 200 92,200 Holding Period > 1 year > 1 year 1 year > 1 year *$30,000 of the gain is 25 percent gain (from accumulated depreciation on the property). Ignore the Net Investment Income Tax. b. Given that Ron and Anne have taxable income of $399,100 (all ordinary) before considering the tax effect of their asset sales, what is their gross tax liability for 2019 assuming they file a joint return? (Round all your intermediate computations to the nearest whole dollar amount.) Gross tax liability $ 36,040 Tax Rates for Net Capital Gains and Qualified Dividends Rate 0% 15% 20% Married Filing Jointly $0 - $78,750 $78,751 - $488,850 $488.851+ Married Filing Separately SO - $39,375 $39,376 - $244.425 $244.426+ Taxable Income Single $0-$39,375 $39,376 - S434,550 $434,551+ Head of Household $0 - $52,750 $52.751 - $461,700 $461,701+ Trusts and Estates $0-$2,650 $2.651 - $12.950 $12.951+ | *This rate applies to the net capital gains and qualified dividends that fall within the range of taxable income specified in the table (net capital gains and qualified dividends are included in taxable income last for this purpose). Schedule Y-1-Married Filing Jointly or Qualifying Widow(er) If taxable income is over: But not over: The tax is: $ 0 $ 19,400 10% of taxable income $ 19,400 $ 78,950 $1,940 plus 12% of the excess over $19,400 $ 78,950 $168,400 $9,086 plus 22% of the excess over $78,950 $168,400 $321,450 $28,765 plus 24% of the excess over $168,400 $321,450 $408,200 $65,497 plus 32% of the excess over $321,450 $408,200 $612,350 $93,257 plus 35% of the excess over $408,200 $612,350 $164,709.50 plus 37% of the excess over $612,350

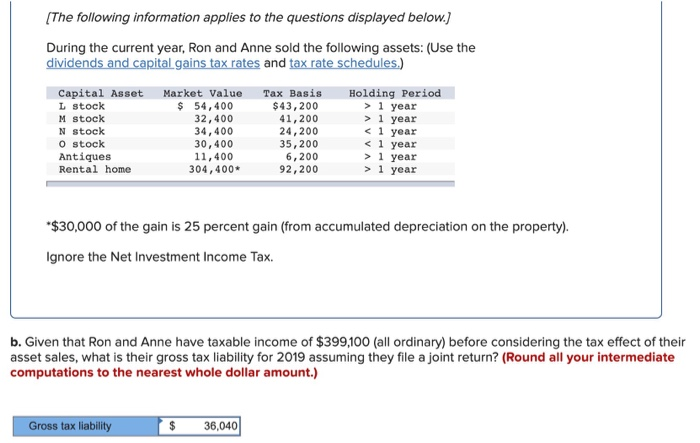
Step by Step Solution

There are 3 Steps involved in it

Step: 1

blur-text-image

Get Instant Access to Expert-Tailored Solutions

See step-by-step solutions with expert insights and AI powered tools for academic success

Step: 2

blur-text-image

Step: 3

blur-text-image

Ace Your Homework with AI

Get the answers you need in no time with our AI-driven, step-by-step assistance

Get Started

Recommended Textbook for

Financial Statement Analysis And Earnings Forecasting In Accounting

Authors: Steven J Monahan

1st Edition

1680834509, 978-1680834505

More Books

Students also viewed these Accounting questions