

Answered step by step
Verified Expert Solution
Question
1 Approved Answer
Please show step by step solutions Integrative Cases Cost Volume Profit Analysis Three entrepreneurs were looking to start a new brewpub near Sacramento, Califomia, called
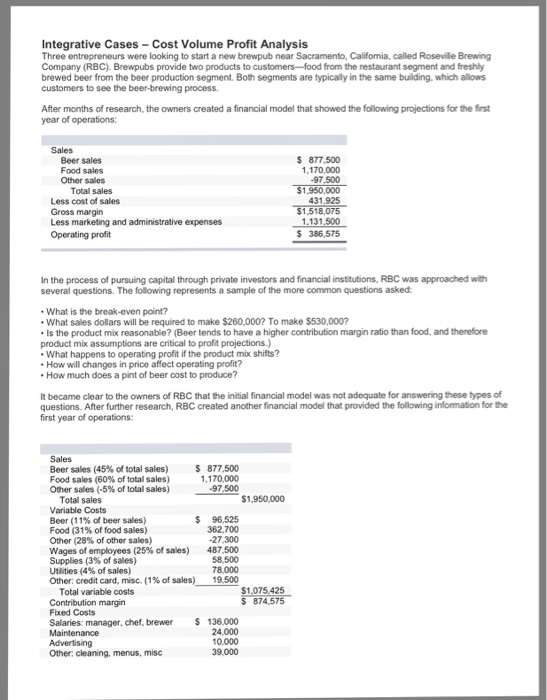
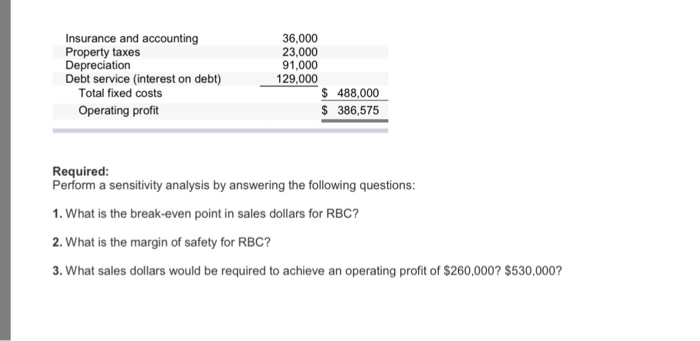 Please show step by step solutions
 Step by Step Solution
There are 3 Steps involved in it
Step: 1

Get Instant Access to Expert-Tailored Solutions
See step-by-step solutions with expert insights and AI powered tools for academic success
Step: 2

Step: 3
Ace Your Homework with AI
Get the answers you need in no time with our AI-driven, step-by-step assistance
Get Started
AS9101D Auditing For Process Performance Combining Conformance And Effectiveness To Meet Customer Satisfaction
Authors: Chad Kymal
1st Edition
0873898079, 978-0873898072