Answered step by step
Verified Expert Solution
Question
1 Approved Answer
Please show steps without using excel. Thank you W (MS) Sharpe Ratio 0.0641 0.0909 0.1212 0.1520 0.1786 0.1967 0.2053 0.2063 0.2029 0.1974 0.1913 0 0.1
Please show steps without using excel. Thank you
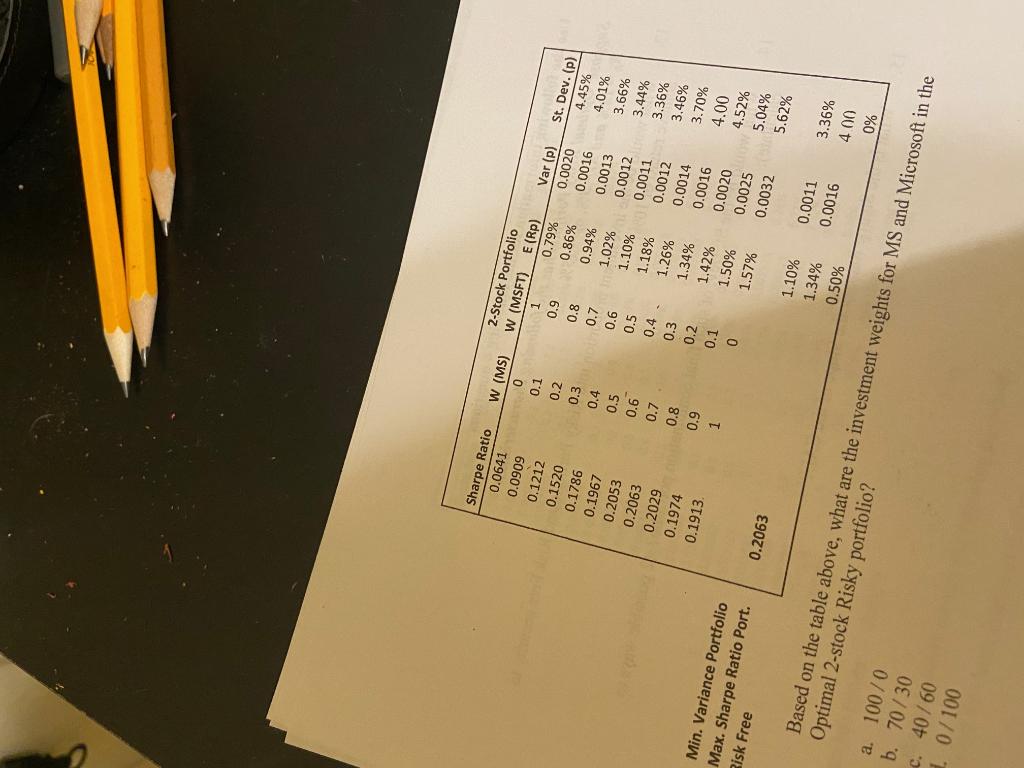
W (MS) Sharpe Ratio 0.0641 0.0909 0.1212 0.1520 0.1786 0.1967 0.2053 0.2063 0.2029 0.1974 0.1913 0 0.1 0.2 0.3 0.4 0.5 0.6 0.7 0.8 0.9 1 2-Stock Portfolio W (MSFT) E (Rp) 1 0.79% 0.9 0.86% 0.8 0.94% 0.7 1.02% 0.6 1.10% 0.5 1.18% 0.4 1.26% 0.3 1.34% 0.2 1.42% 0.1 1.50% 0 1.57% Var (P) St. Dev. (p) 0.0020 4.45% 0.0016 4.01% 0.0013 3.66% 0.0012 3.44% 0.0011 3.36% 0.0012 3.46% 0.0014 3.70% 0.0016 4.00 0.0020 4.52% 0.0025 5.04% 0.0032 5.62% Min. Variance Portfolio Max. Sharpe Ratio Port. Bisk Free 0.2063 1.10% 1.34% 0.50% 0.0011 0.0016 3.36% 4.00 0% a. 100/0 b. 70/30 c. 40/60 0/100 Based on the table above, what are the investment weights for MS and Microsoft in the Optimal 2-stock Risky portfolio? W (MS) Sharpe Ratio 0.0641 0.0909 0.1212 0.1520 0.1786 0.1967 0.2053 0.2063 0.2029 0.1974 0.1913 0 0.1 0.2 0.3 0.4 0.5 0.6 0.7 0.8 0.9 1 2-Stock Portfolio W (MSFT) E (Rp) 1 0.79% 0.9 0.86% 0.8 0.94% 0.7 1.02% 0.6 1.10% 0.5 1.18% 0.4 1.26% 0.3 1.34% 0.2 1.42% 0.1 1.50% 0 1.57% Var (P) St. Dev. (p) 0.0020 4.45% 0.0016 4.01% 0.0013 3.66% 0.0012 3.44% 0.0011 3.36% 0.0012 3.46% 0.0014 3.70% 0.0016 4.00 0.0020 4.52% 0.0025 5.04% 0.0032 5.62% Min. Variance Portfolio Max. Sharpe Ratio Port. Bisk Free 0.2063 1.10% 1.34% 0.50% 0.0011 0.0016 3.36% 4.00 0% a. 100/0 b. 70/30 c. 40/60 0/100 Based on the table above, what are the investment weights for MS and Microsoft in the Optimal 2-stock Risky portfolioStep by Step Solution
There are 3 Steps involved in it
Step: 1
Get Instant Access to Expert-Tailored Solutions
See step-by-step solutions with expert insights and AI powered tools for academic success
Step: 2
Step: 3
Ace Your Homework with AI
Get the answers you need in no time with our AI-driven, step-by-step assistance
Get Started