

Answered step by step
Verified Expert Solution
Question
1 Approved Answer
please show the excel 2. The U.S. Department of Agriculture (USDA) uses sample surveys to produce important economic estimates. One pilot study estimated durum wheat
please show the excel 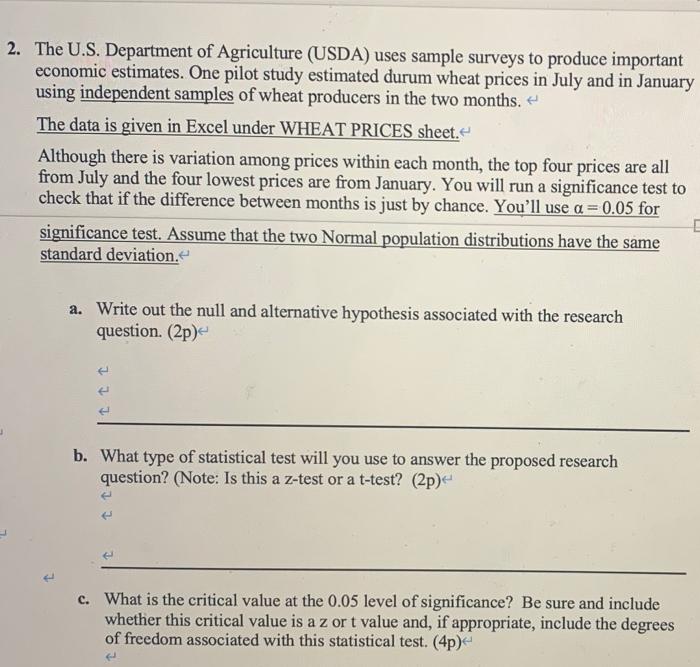
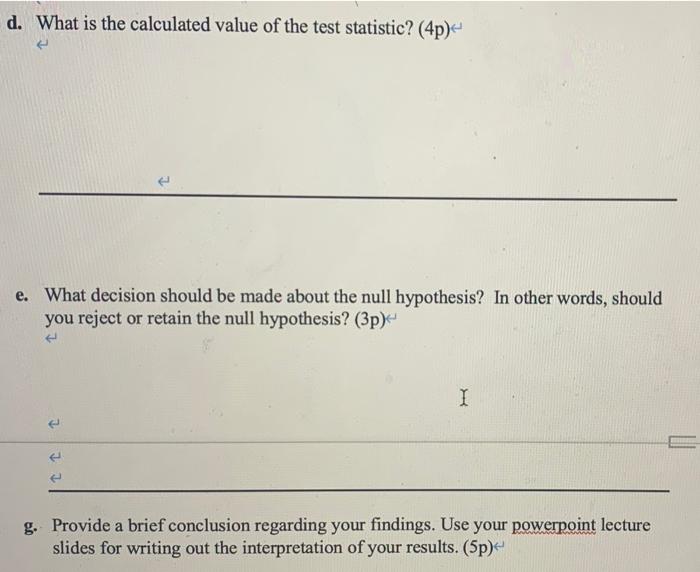
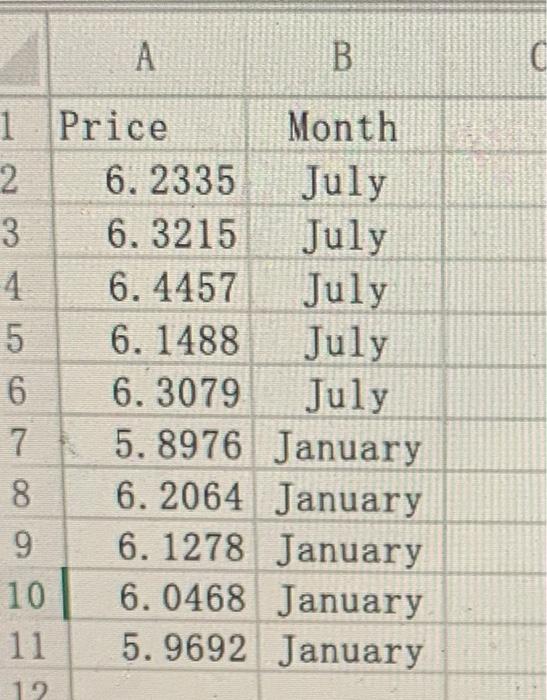
2. The U.S. Department of Agriculture (USDA) uses sample surveys to produce important economic estimates. One pilot study estimated durum wheat prices in July and in January using independent samples of wheat producers in the two months. + The data is given in Excel under WHEAT PRICES sheet. Although there is variation among prices within each month, the top four prices are all from July and the four lowest prices are from January. You will run a significance test to check that if the difference between months is just by chance. You'll use a = 0.05 for significance test. Assume that the two Normal population distributions have the same standard deviation a. Write out the null and alternative hypothesis associated with the research question. (2p) b. What type of statistical test will you use to answer the proposed research question? (Note: Is this a z-test or a t-test? (2p) c. What is the critical value at the 0.05 level of significance? Be sure and include whether this critical value is a z ort value and, if appropriate, include the degrees of freedom associated with this statistical test. (4) d. What is the calculated value of the test statistic? (4p) e. What decision should be made about the null hypothesis? In other words, should you reject or retain the null hypothesis? (3p) I ee a g. Provide a brief conclusion regarding your findings. Use your powerpoint lecture slides for writing out the interpretation of your results. (5p) B C 1 Price Month 2 6. 2335 July 3 6.3215 July 4 6. 4457 July 5 6. 1488 July 6 6. 3079 July 7 5.8976 January 8 6. 2064 January 9. 6. 1278 January 10 6. 0468 January 11 5. 9692 January 000 12 Step by Step Solution
There are 3 Steps involved in it
Step: 1

Get Instant Access to Expert-Tailored Solutions
See step-by-step solutions with expert insights and AI powered tools for academic success
Step: 2

Step: 3
Ace Your Homework with AI
Get the answers you need in no time with our AI-driven, step-by-step assistance
Get Started
The Technical Analysis Course Learn How To Forecast And Time The Market
Authors: Thomas Meyers
4th Edition
0071749020,0071749039