Answered step by step
Verified Expert Solution
Question
1 Approved Answer
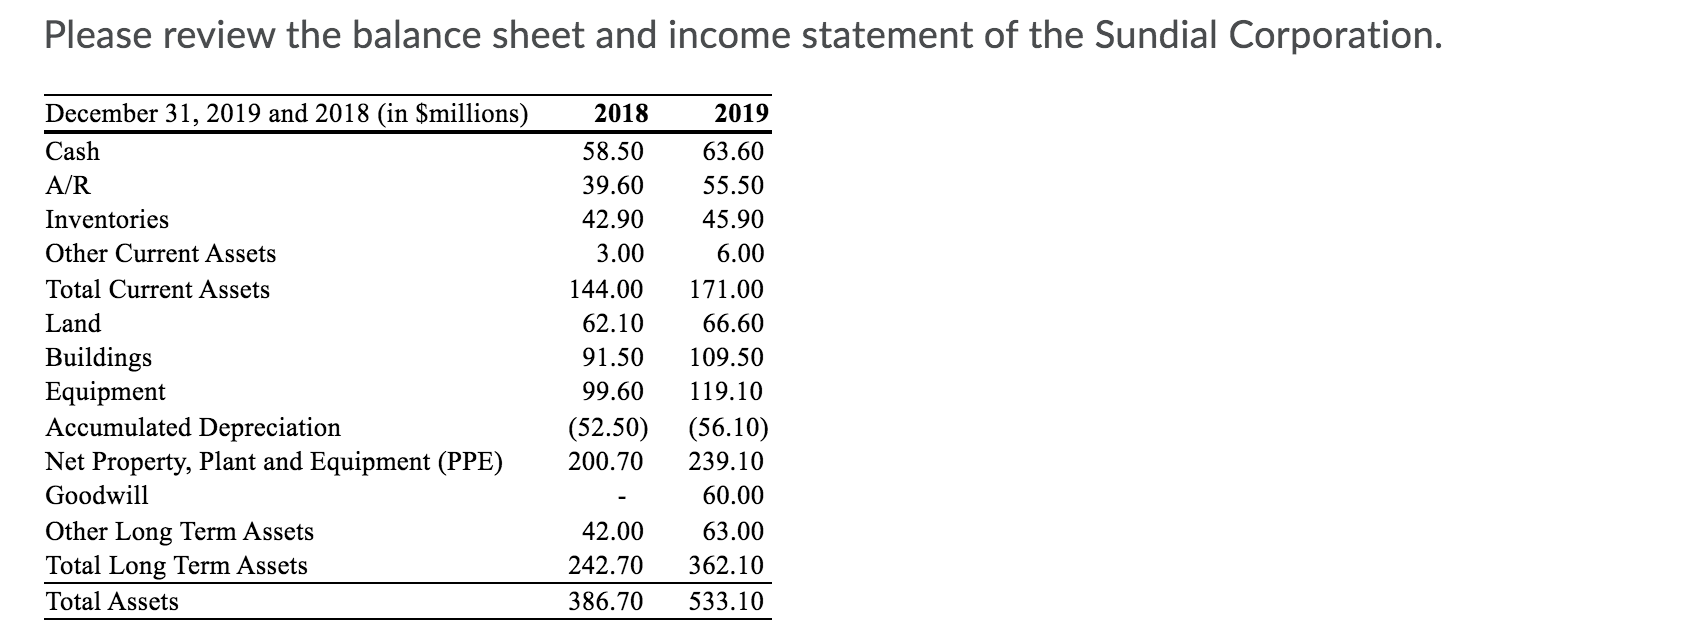
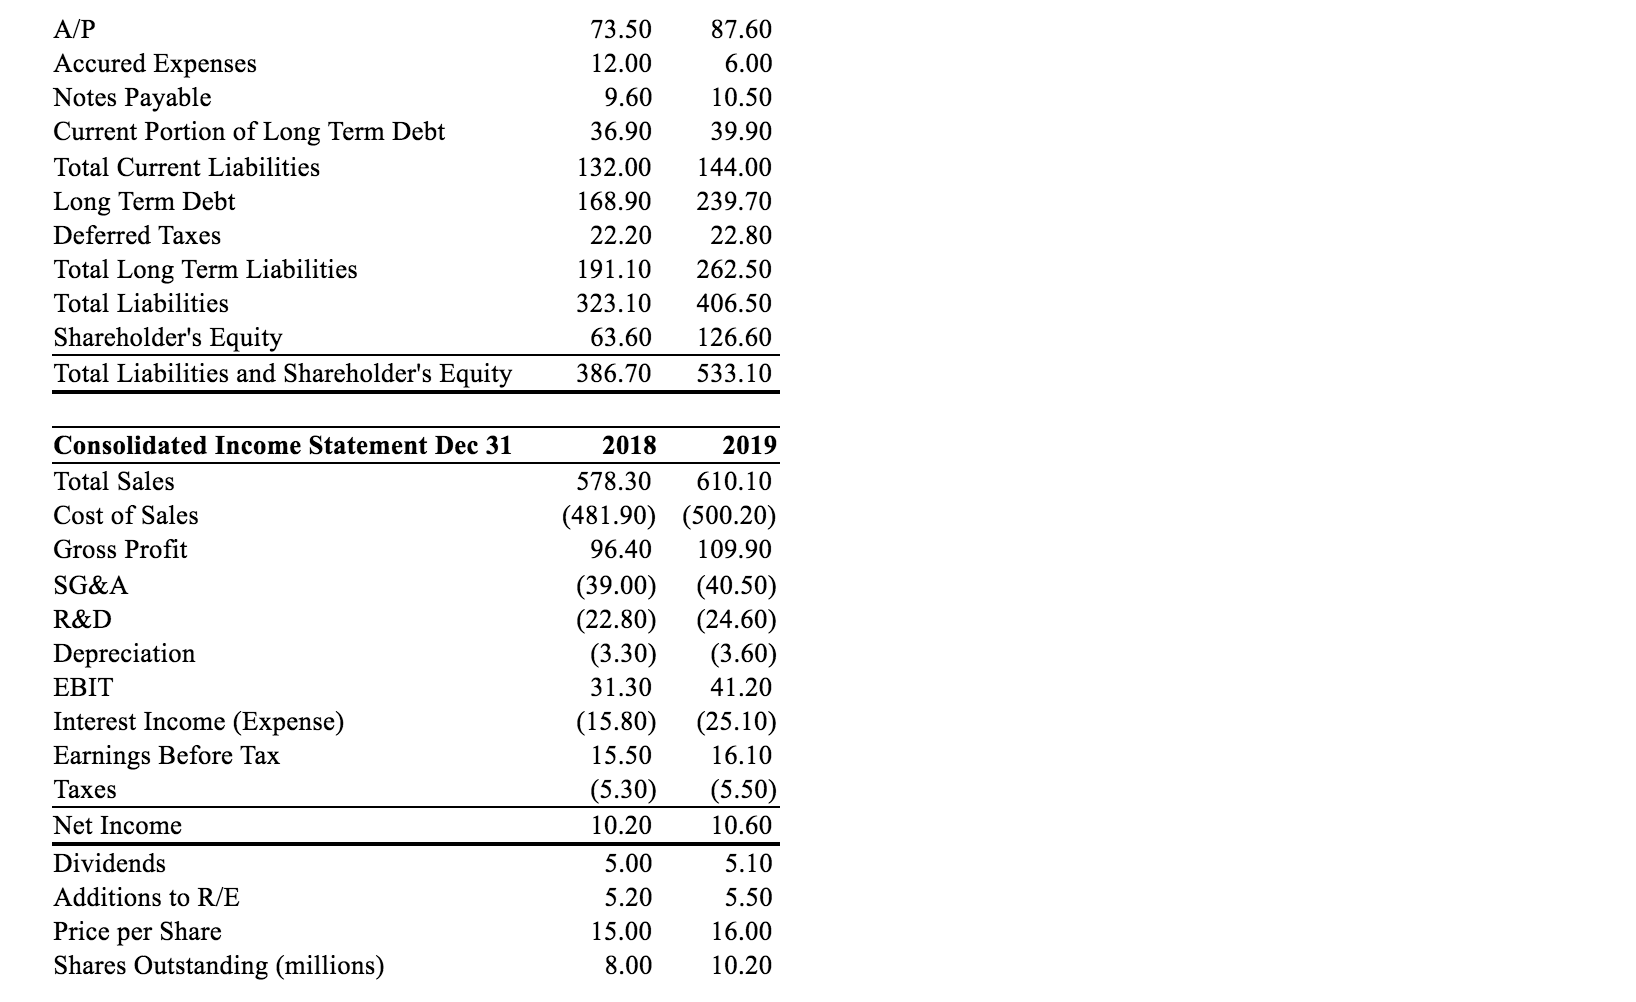
Please show why/how Please review the balance sheet and income statement of the Sundial Corporation. 2018 December 31, 2019 and 2018 (in $millions) Cash AR


Please show why/how
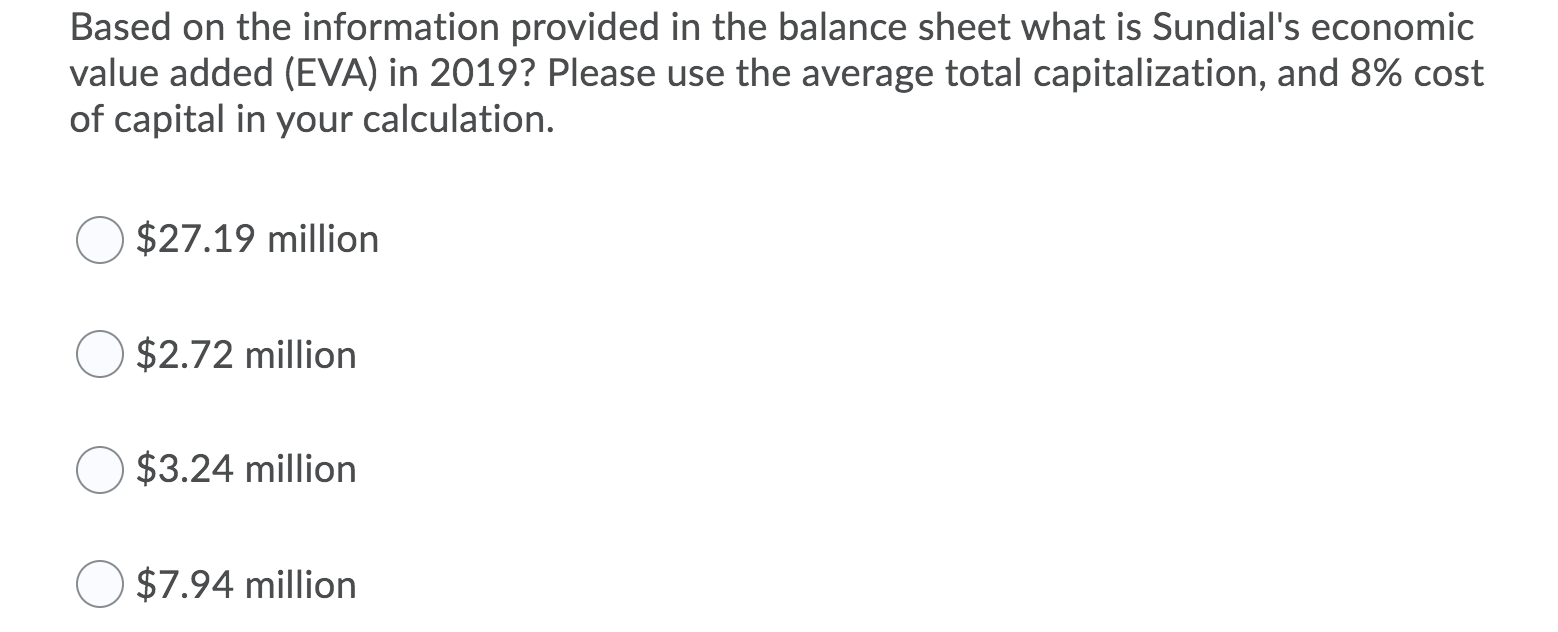
Please review the balance sheet and income statement of the Sundial Corporation. 2018 December 31, 2019 and 2018 (in $millions) Cash AR Inventories Other Current Assets Total Current Assets Land Buildings Equipment Accumulated Depreciation Net Property, Plant and Equipment (PPE) Goodwill Other Long Term Assets Total Long Term Assets Total Assets 58.50 39.60 42.90 3.00 144.00 62.10 91.50 99.60 (52.50) 200.70 2019 63.60 55.50 45.90 6.00 171.00 66.60 109.50 119.10 (56.10) 239.10 60.00 63.00 362.10 533.10 42.00 242.70 386.70 A/P Accured Expenses Notes Payable Current Portion of Long Term Debt Total Current Liabilities Long Term Debt Deferred Taxes Total Long Term Liabilities Total Liabilities Shareholder's Equity Total Liabilities and Shareholder's Equity 73.50 12.00 9.60 36.90 132.00 168.90 22.20 191.10 323.10 63.60 386.70 87.60 6.00 10.50 39.90 144.00 239.70 22.80 262.50 406.50 126.60 533.10 Consolidated Income Statement Dec 31 Total Sales Cost of Sales Gross Profit SG&A R&D Depreciation EBIT Interest Income (Expense) Earnings Before Tax Taxes Net Income Dividends Additions to R/E Price per Share Shares Outstanding (millions) 2018 2019 578.30 610.10 (481.90) (500.20) 96.40 109.90 (39.00) (40.50) (22.80) (24.60) (3.30) (3.60) 31.30 41.20 (15.80) (25.10) 15.50 16.10 (5.30) (5.50) 10.20 10.60 5.00 5.10 5.20 5.50 15.00 16.00 8.00 10.20 Based on the information provided in the balance sheet what is Sundial's economic value added (EVA) in 2019? Please use the average total capitalization, and 8% cost of capital in your calculation. $27.19 million $2.72 million $3.24 million $7.94 million Please review the balance sheet and income statement of the Sundial Corporation. 2018 December 31, 2019 and 2018 (in $millions) Cash AR Inventories Other Current Assets Total Current Assets Land Buildings Equipment Accumulated Depreciation Net Property, Plant and Equipment (PPE) Goodwill Other Long Term Assets Total Long Term Assets Total Assets 58.50 39.60 42.90 3.00 144.00 62.10 91.50 99.60 (52.50) 200.70 2019 63.60 55.50 45.90 6.00 171.00 66.60 109.50 119.10 (56.10) 239.10 60.00 63.00 362.10 533.10 42.00 242.70 386.70 A/P Accured Expenses Notes Payable Current Portion of Long Term Debt Total Current Liabilities Long Term Debt Deferred Taxes Total Long Term Liabilities Total Liabilities Shareholder's Equity Total Liabilities and Shareholder's Equity 73.50 12.00 9.60 36.90 132.00 168.90 22.20 191.10 323.10 63.60 386.70 87.60 6.00 10.50 39.90 144.00 239.70 22.80 262.50 406.50 126.60 533.10 Consolidated Income Statement Dec 31 Total Sales Cost of Sales Gross Profit SG&A R&D Depreciation EBIT Interest Income (Expense) Earnings Before Tax Taxes Net Income Dividends Additions to R/E Price per Share Shares Outstanding (millions) 2018 2019 578.30 610.10 (481.90) (500.20) 96.40 109.90 (39.00) (40.50) (22.80) (24.60) (3.30) (3.60) 31.30 41.20 (15.80) (25.10) 15.50 16.10 (5.30) (5.50) 10.20 10.60 5.00 5.10 5.20 5.50 15.00 16.00 8.00 10.20 Based on the information provided in the balance sheet what is Sundial's economic value added (EVA) in 2019? Please use the average total capitalization, and 8% cost of capital in your calculation. $27.19 million $2.72 million $3.24 million $7.94 millionStep by Step Solution
There are 3 Steps involved in it
Step: 1

Get Instant Access to Expert-Tailored Solutions
See step-by-step solutions with expert insights and AI powered tools for academic success
Step: 2

Step: 3

Ace Your Homework with AI
Get the answers you need in no time with our AI-driven, step-by-step assistance
Get Started


