

Question: Please show work I'll like the post QUESTION 23 (10 points) - P-Charts & C-Charts Based on two separate data files TOM3010_OM_HW_Question23_Data-PChart.xlsx and TOM3010_OM_HW3_Question23_Data-CChart.xlsx, you
Please show work I'll like the post
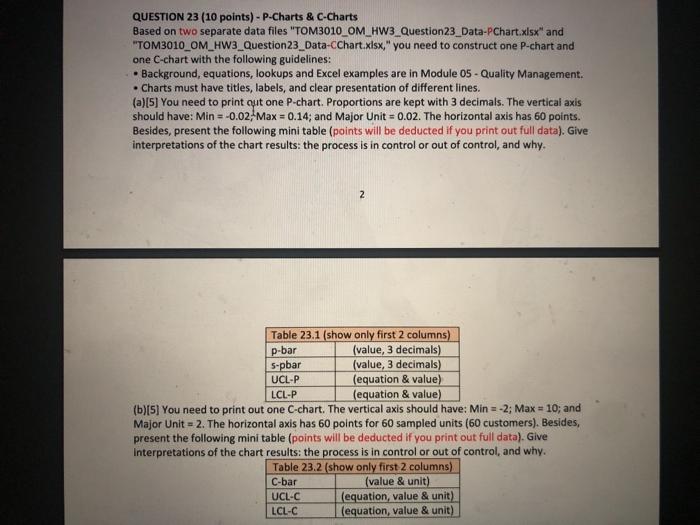
QUESTION 23 (10 points) - P-Charts & C-Charts Based on two separate data files "TOM3010_OM_HW_Question23_Data-PChart.xlsx" and "TOM3010_OM_HW3_Question23_Data-CChart.xlsx," you need to construct one p-chart and one C-chart with the following guidelines: Background, equations, lookups and Excel examples are in Module 05 - Quality Management. Charts must have titles, labels, and clear presentation of different lines. (a) [5] You need to print out one p-chart. Proportions are kept with 3 decimals. The vertical axis should have: Min = -0.02. Max = 0.14; and Major Unit = 0.02. The horizontal axis has 60 points. Besides, present the following mini table (points will be deducted if you print out full data). Give interpretations of the chart results: the process is in control or out of control, and why. 2 p-bar Table 23.1 (show only first 2 columns) (value, 3 decimals) s-pbar (value, 3 decimals) UCL-P (equation & value) LCL-P (equation & value) (b)(5) You need to print out one C-chart. The vertical axis should have: Min = -2; Max = 10; and Major Unit = 2. The horizontal axis has 60 points for 60 sampled units (60 customers). Besides, present the following mini table (points will be deducted if you print out full data). Give Interpretations of the chart results: the process is in control or out of control, and why. Table 23.2 (show only first 2 columns) C-bar (value & unit) UCL-C (equation, value & unit) LCL-C (equation, value & unit) QUESTION 23 (10 points) - P-Charts & C-Charts Based on two separate data files "TOM3010_OM_HW_Question23_Data-PChart.xlsx" and "TOM3010_OM_HW3_Question23_Data-CChart.xlsx," you need to construct one p-chart and one C-chart with the following guidelines: Background, equations, lookups and Excel examples are in Module 05 - Quality Management. Charts must have titles, labels, and clear presentation of different lines. (a) [5] You need to print out one p-chart. Proportions are kept with 3 decimals. The vertical axis should have: Min = -0.02. Max = 0.14; and Major Unit = 0.02. The horizontal axis has 60 points. Besides, present the following mini table (points will be deducted if you print out full data). Give interpretations of the chart results: the process is in control or out of control, and why. 2 p-bar Table 23.1 (show only first 2 columns) (value, 3 decimals) s-pbar (value, 3 decimals) UCL-P (equation & value) LCL-P (equation & value) (b)(5) You need to print out one C-chart. The vertical axis should have: Min = -2; Max = 10; and Major Unit = 2. The horizontal axis has 60 points for 60 sampled units (60 customers). Besides, present the following mini table (points will be deducted if you print out full data). Give Interpretations of the chart results: the process is in control or out of control, and why. Table 23.2 (show only first 2 columns) C-bar (value & unit) UCL-C (equation, value & unit) LCL-C (equation, value & unit)
Step by Step Solution
There are 3 Steps involved in it
1 Expert Approved Answer
Step: 1 Unlock

Question Has Been Solved by an Expert!
Get step-by-step solutions from verified subject matter experts
Step: 2 Unlock
Step: 3 Unlock