Please show work on excel.
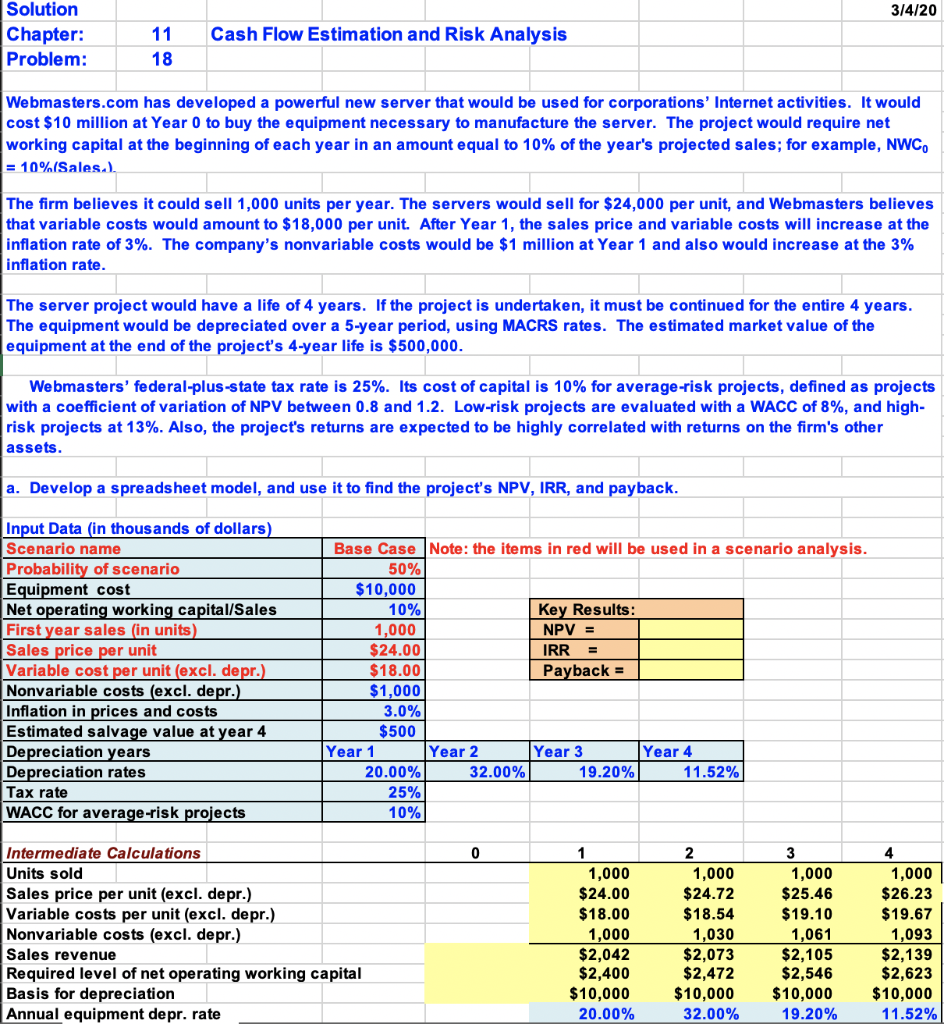
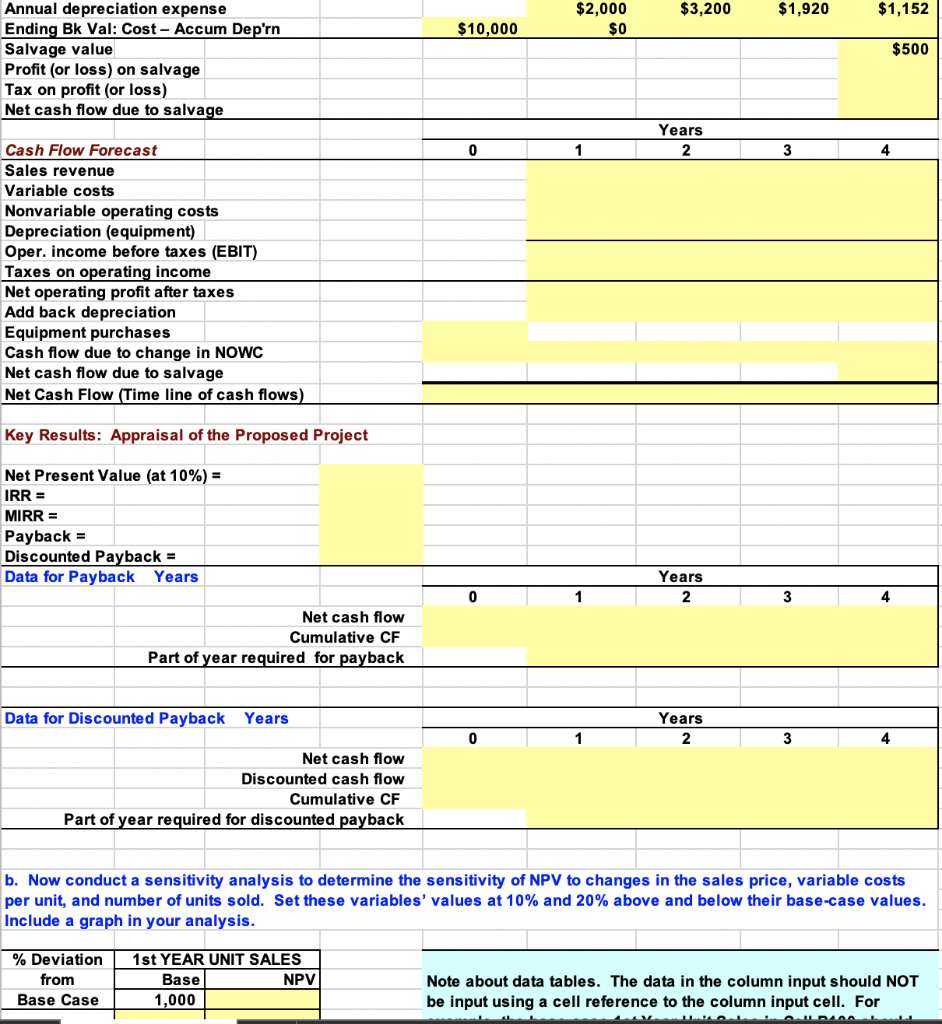
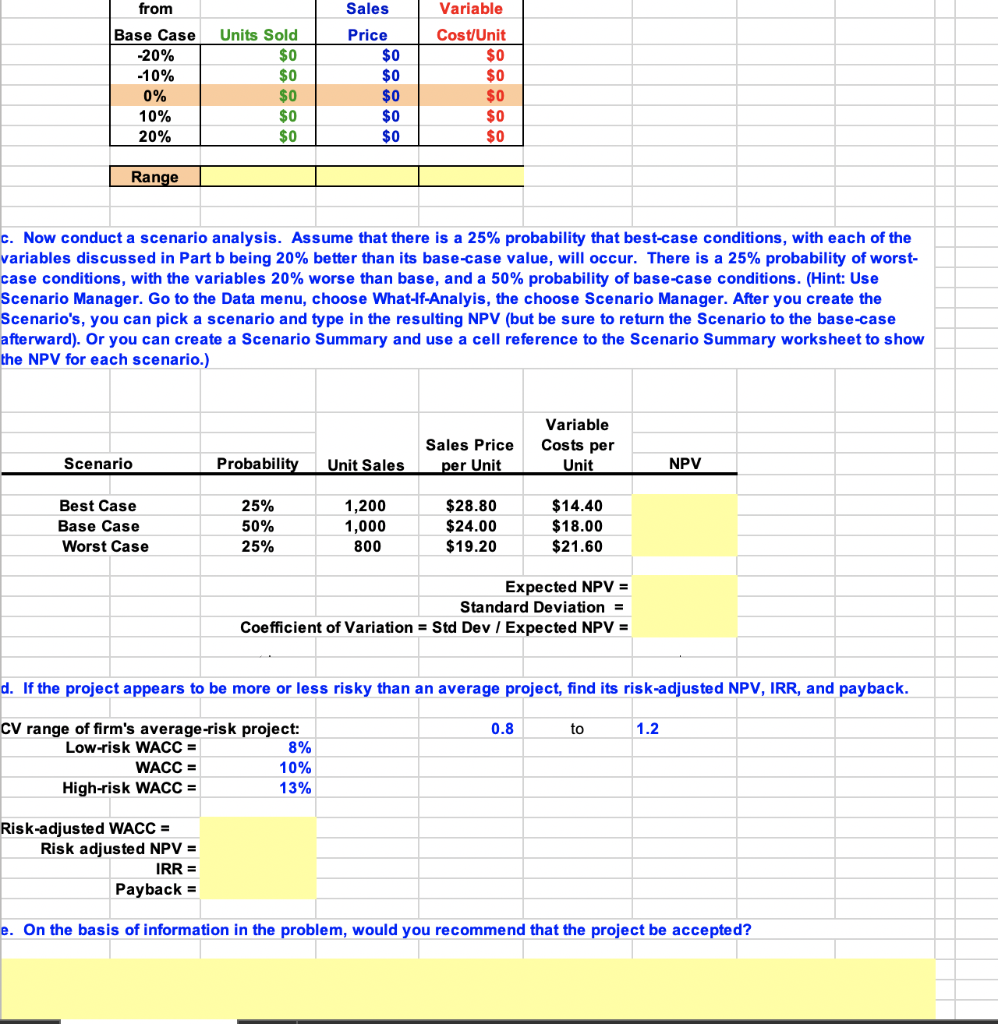
cost $10 million at Year 0 to buy the equipment necessary to manufacture the server. The project would require net working capital at the beginning of each year in an amount equal to 10% of the year's projected sales; for example, NWC =10%( Sales A) The firm believes it could sell 1,000 units per year. The servers would sell for $$24,000 per unit, and Webmasters believes that variable costs would amount to $18,000 per unit. After Year 1 , the sales price and variable costs will increase at the inflation rate of 3%. The company's nonvariable costs would be $1 million at Year 1 and also would increase at the 3% inflation rate. The server project would have a life of 4 years. If the project is undertaken, it must be continued for the entire 4 years. The equipment would be depreciated over a 5-year period, using MACRS rates. The estimated market value of the equipment at the end of the project's 4year life is $500,000. Webmasters' federal-plus-state tax rate is 25%. Its cost of capital is 10% for average-risk projects, defined as projects with a coefficient of variation of NPV between 0.8 and 1.2. Low-risk projects are evaluated with a WACC of 8%, and highrisk projects at 13%. Also, the project's returns are expected to be highly correlated with returns on the firm's other assets. a. Develop a spreadsheet model, and use it to find the project's NPV, IRR, and payback. b. Now conduct a sensitivity analysis to determine the sensitivity of NPV to changes in the sales price, variable costs per unit, and number of units sold. Set these variables' values at 10% and 20% above and below their base-case values. Include a graph in your analysis. \begin{tabular}{|c|r|r|r|} \hline from & Sales & Variable \\ \hline Base Case & Units Sold & Price & Cost/Unit \\ \hline20% & $0 & $0 & $0 \\ 10% & $0 & $0 & $0 \\ 0% & $0 & $0 & $0 \\ 10% & $0 & $0 & $0 \\ 20% & $0 & $0 & $0 \\ \hline \end{tabular} \begin{tabular}{|l|l|l|l} \hline Range & & & \\ \hline \end{tabular} c. Now conduct a scenario analysis. Assume that there is a 25% probability that best-case conditions, with each of the variables discussed in Part b being 20% better than its base-case value, will occur. There is a 25% probability of worstcase conditions, with the variables 20% worse than base, and a 50% probability of base-case conditions. (Hint: Use Scenario Manager. Go to the Data menu, choose What-If-Analyis, the choose Scenario Manager. After you create the Scenario's, you can pick a scenario and type in the resulting NPV (but be sure to return the Scenario to the base-case afterward). Or you can create a Scenario Summary and use a cell reference to the Scenario Summary worksheet to show the NPV for each scenario.) Expected NPV = Standard Deviation = Coefficient of Variation = Std Dev / Expected NPV = d. If the project appears to be more or less risky than an average project, find its risk-adjusted NPV, IRR, and payback. \begin{tabular}{rr|} \hline CV range of firm's average-risk project: \\ \hline Low-risk WACC = & 8% \\ \hline WACC = & 10% \\ \hline High-risk WACC = & 13% \\ \hline \end{tabular} Risk-adjusted WACC = Risk adjusted NPV = IRR = Payback = e. On the basis of information in the problem, would you recommend that the project be accepted? cost $10 million at Year 0 to buy the equipment necessary to manufacture the server. The project would require net working capital at the beginning of each year in an amount equal to 10% of the year's projected sales; for example, NWC =10%( Sales A) The firm believes it could sell 1,000 units per year. The servers would sell for $$24,000 per unit, and Webmasters believes that variable costs would amount to $18,000 per unit. After Year 1 , the sales price and variable costs will increase at the inflation rate of 3%. The company's nonvariable costs would be $1 million at Year 1 and also would increase at the 3% inflation rate. The server project would have a life of 4 years. If the project is undertaken, it must be continued for the entire 4 years. The equipment would be depreciated over a 5-year period, using MACRS rates. The estimated market value of the equipment at the end of the project's 4year life is $500,000. Webmasters' federal-plus-state tax rate is 25%. Its cost of capital is 10% for average-risk projects, defined as projects with a coefficient of variation of NPV between 0.8 and 1.2. Low-risk projects are evaluated with a WACC of 8%, and highrisk projects at 13%. Also, the project's returns are expected to be highly correlated with returns on the firm's other assets. a. Develop a spreadsheet model, and use it to find the project's NPV, IRR, and payback. b. Now conduct a sensitivity analysis to determine the sensitivity of NPV to changes in the sales price, variable costs per unit, and number of units sold. Set these variables' values at 10% and 20% above and below their base-case values. Include a graph in your analysis. \begin{tabular}{|c|r|r|r|} \hline from & Sales & Variable \\ \hline Base Case & Units Sold & Price & Cost/Unit \\ \hline20% & $0 & $0 & $0 \\ 10% & $0 & $0 & $0 \\ 0% & $0 & $0 & $0 \\ 10% & $0 & $0 & $0 \\ 20% & $0 & $0 & $0 \\ \hline \end{tabular} \begin{tabular}{|l|l|l|l} \hline Range & & & \\ \hline \end{tabular} c. Now conduct a scenario analysis. Assume that there is a 25% probability that best-case conditions, with each of the variables discussed in Part b being 20% better than its base-case value, will occur. There is a 25% probability of worstcase conditions, with the variables 20% worse than base, and a 50% probability of base-case conditions. (Hint: Use Scenario Manager. Go to the Data menu, choose What-If-Analyis, the choose Scenario Manager. After you create the Scenario's, you can pick a scenario and type in the resulting NPV (but be sure to return the Scenario to the base-case afterward). Or you can create a Scenario Summary and use a cell reference to the Scenario Summary worksheet to show the NPV for each scenario.) Expected NPV = Standard Deviation = Coefficient of Variation = Std Dev / Expected NPV = d. If the project appears to be more or less risky than an average project, find its risk-adjusted NPV, IRR, and payback. \begin{tabular}{rr|} \hline CV range of firm's average-risk project: \\ \hline Low-risk WACC = & 8% \\ \hline WACC = & 10% \\ \hline High-risk WACC = & 13% \\ \hline \end{tabular} Risk-adjusted WACC = Risk adjusted NPV = IRR = Payback = e. On the basis of information in the problem, would you recommend that the project be accepted