Please show work on excel :D
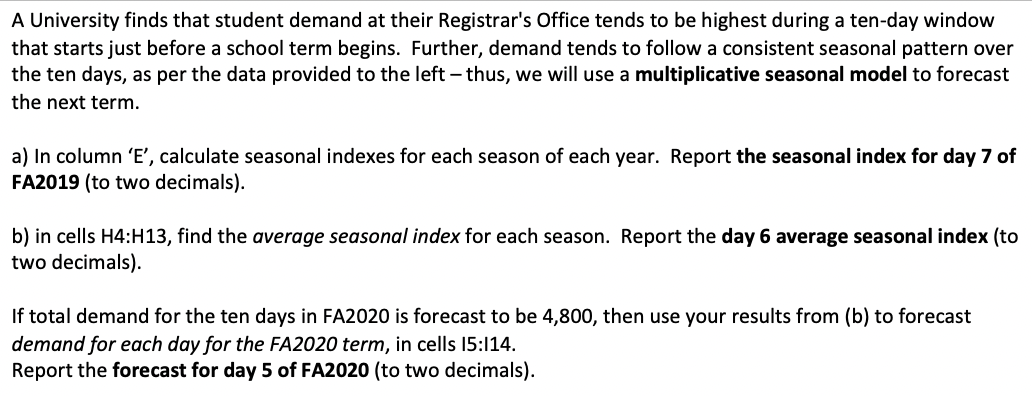
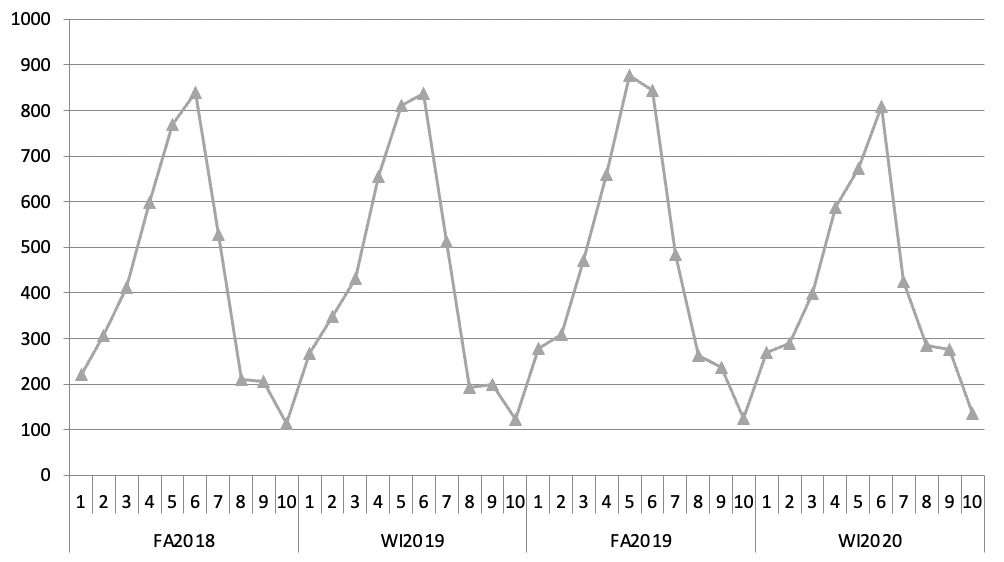
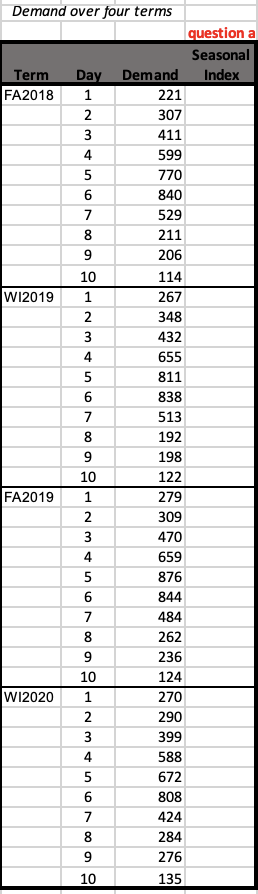
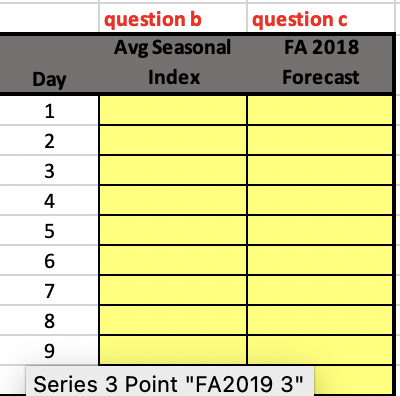
A University finds that student demand at their Registrar's Office tends to be highest during a ten-day window that starts just before a school term begins. Further, demand tends to follow a consistent seasonal pattern over the ten days, as per the data provided to the left - thus, we will use a multiplicative seasonal model to forecast the next term. a) In column ' E ', calculate seasonal indexes for each season of each year. Report the seasonal index for day 7 of FA2019 (to two decimals). b) in cells H4:H13, find the average seasonal index for each season. Report the day 6 average seasonal index (to two decimals). If total demand for the ten days in FA2020 is forecast to be 4,800, then use your results from (b) to forecast demand for each day for the FA2020 term, in cells I5:I14. Report the forecast for day 5 of FA2020 (to two decimals). Demand over four terms \begin{tabular}{|c|c|r|r|} \hline & & & question a \\ \hline Term & Day & Demand & Seasonal \\ Index \\ \hline FA2018 & 1 & 221 & \\ \hline & 2 & 307 & \\ \hline & 3 & 411 \\ \hline & 4 & 599 \\ \hline & 5 & 770 \\ \hline & 6 & 840 \\ \hline & 7 & 529 \\ \hline & 8 & 211 \\ \hline & 9 & 206 \\ \hline WI2019 & 1 & 267 \\ \hline & 2 & 348 \\ \hline & 3 & 432 \\ \hline & 4 & 655 \\ \hline & 10 & \\ \hline & 10 & \\ \hline & & \\ \hline & & \\ \hline & & \\ \hline \end{tabular} A University finds that student demand at their Registrar's Office tends to be highest during a ten-day window that starts just before a school term begins. Further, demand tends to follow a consistent seasonal pattern over the ten days, as per the data provided to the left - thus, we will use a multiplicative seasonal model to forecast the next term. a) In column ' E ', calculate seasonal indexes for each season of each year. Report the seasonal index for day 7 of FA2019 (to two decimals). b) in cells H4:H13, find the average seasonal index for each season. Report the day 6 average seasonal index (to two decimals). If total demand for the ten days in FA2020 is forecast to be 4,800, then use your results from (b) to forecast demand for each day for the FA2020 term, in cells I5:I14. Report the forecast for day 5 of FA2020 (to two decimals). Demand over four terms \begin{tabular}{|c|c|r|r|} \hline & & & question a \\ \hline Term & Day & Demand & Seasonal \\ Index \\ \hline FA2018 & 1 & 221 & \\ \hline & 2 & 307 & \\ \hline & 3 & 411 \\ \hline & 4 & 599 \\ \hline & 5 & 770 \\ \hline & 6 & 840 \\ \hline & 7 & 529 \\ \hline & 8 & 211 \\ \hline & 9 & 206 \\ \hline WI2019 & 1 & 267 \\ \hline & 2 & 348 \\ \hline & 3 & 432 \\ \hline & 4 & 655 \\ \hline & 10 & \\ \hline & 10 & \\ \hline & & \\ \hline & & \\ \hline & & \\ \hline \end{tabular}