

Answered step by step
Verified Expert Solution
Question
1 Approved Answer
Please show work on excel, need help understanding! Starbies Corporation Financial Information The company had total sales of $329 million with net income of $14
Please show work on excel, need help understanding!
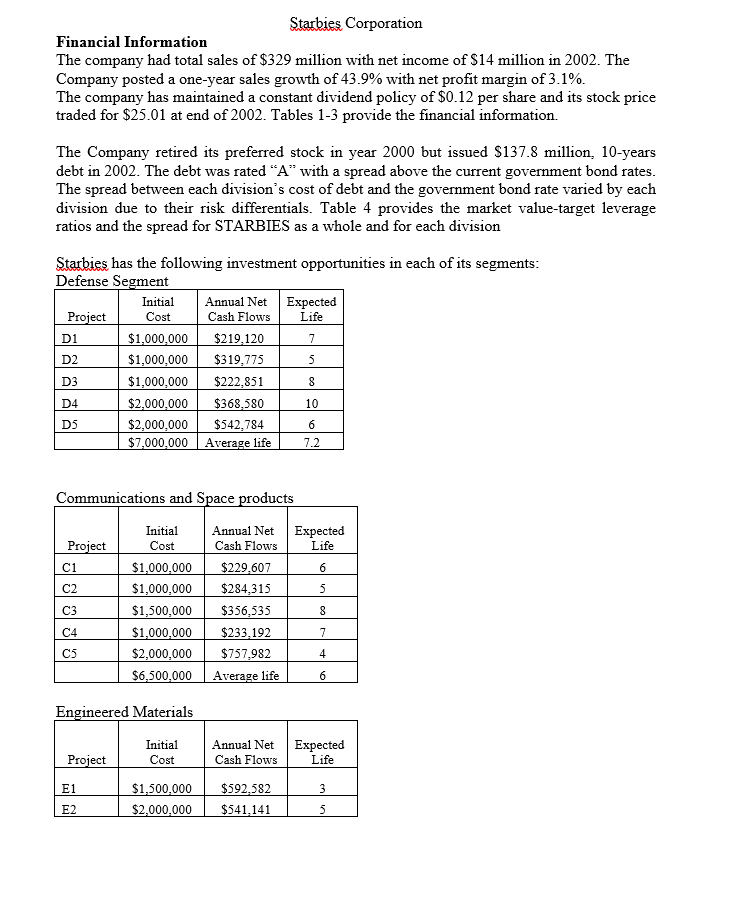
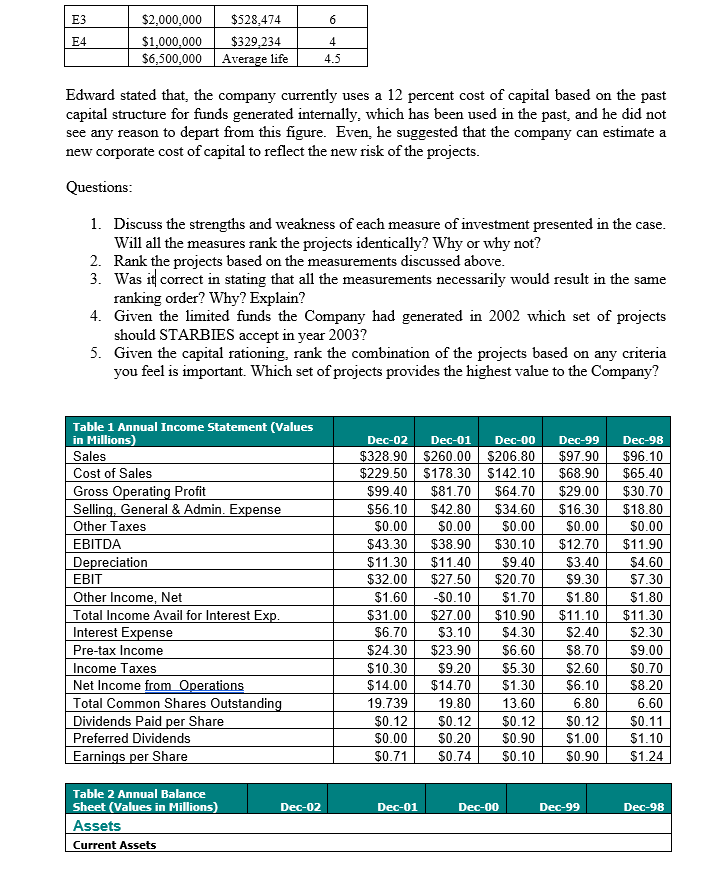
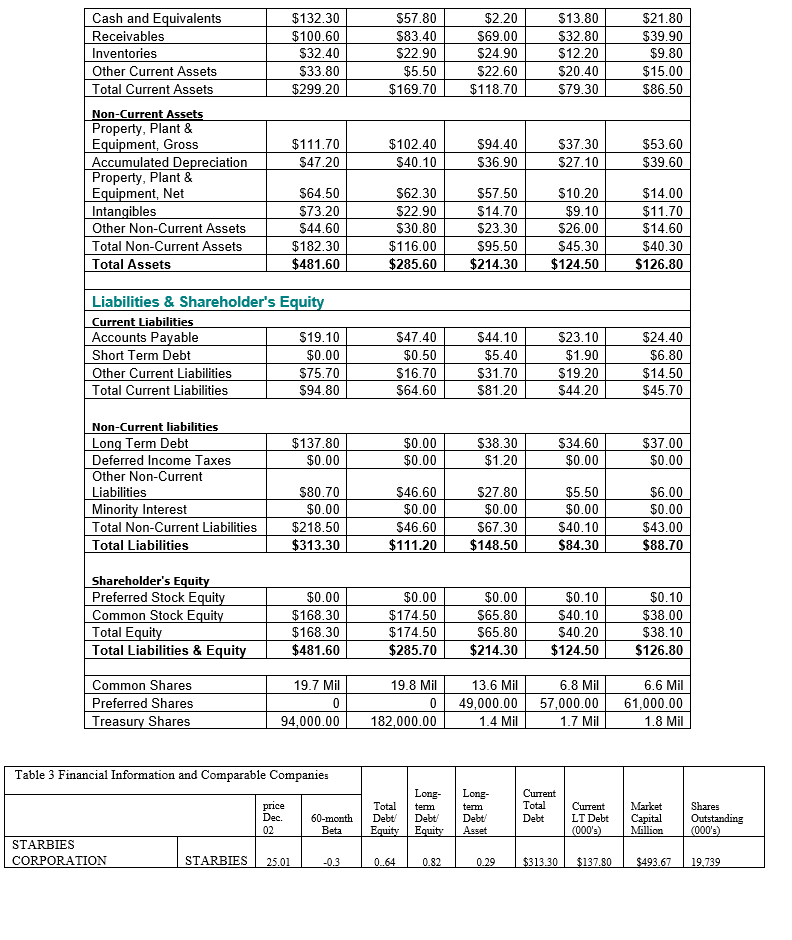
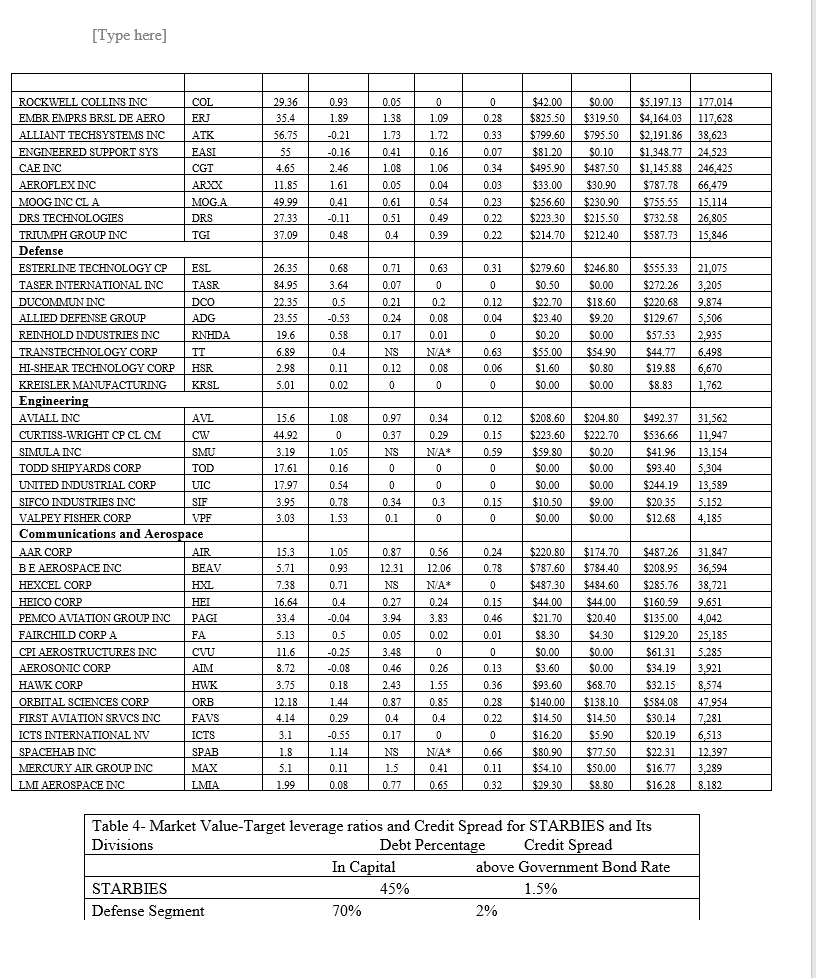
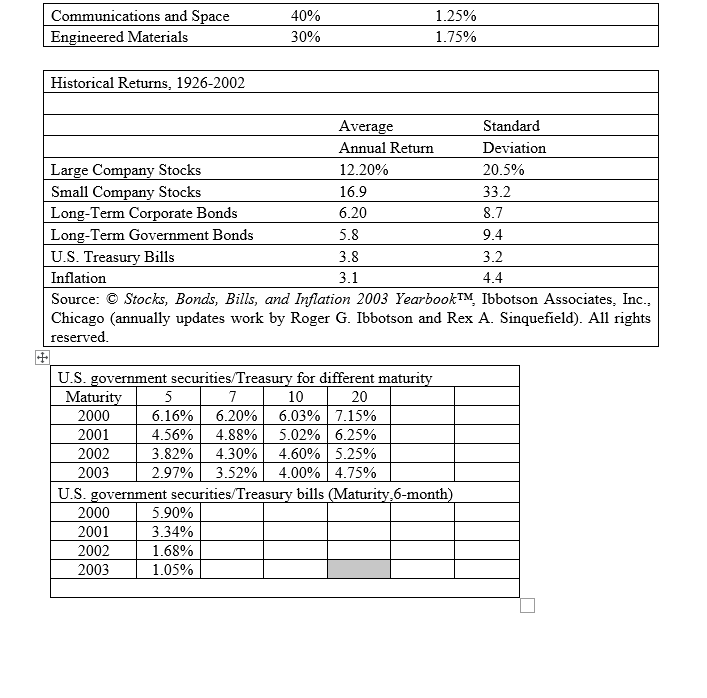
Starbies Corporation Financial Information The company had total sales of $329 million with net income of $14 million in 2002. The Company posted a one-year sales growth of 43.9% with net profit margin of 3.1%. The company has maintained a constant dividend policy of $0.12 per share and its stock price traded for $25.01 at end of 2002. Tables 1-3 provide the financial information. The Company retired its preferred stock in year 2000 but issued $137.8 million, 10-years debt in 2002. The debt was rated A with a spread above the current government bond rates. The spread between each division's cost of debt and the government bond rate varied by each division due to their risk differentials. Table 4 provides the market value-target leverage ratios and the spread for STARBIES as a whole and for each division D1 Starbies has the following investment opportunities in each of its segments: Defense Segment Initial Annual Net Expected Project Cost Cash Flows Life $1,000,000 $219,120 7 D2 $1,000,000 $319,775 5 D3 $1,000,000 $222,851 8 D4 $2,000,000 $368,580 10 DS $2,000,000 $542,784 6 $7,000,000 Average life 7.2 Communications and Space products Expected Life Project C1 6 C2 5 Initial Cost $1,000,000 $1,000,000 $1,500,000 $1,000,000 $2,000,000 $6,500,000 C3 Annual Net Cash Flows $229,607 $284,315 $356,535 $233.192 $757,982 Average life 8 C4 7 C5 4 6 Engineered Materials Initial Cost Annual Net Cash Flows Expected Life Project E1 3 $1,500,000 $2,000,000 $592,582 $541,141 E2 5 E3 6 E4 $2,000,000 $528,474 $1,000,000 $329,234 $6,500,000 Average life 4 4.5 Edward stated that, the company currently uses a 12 percent cost of capital based on the past capital structure for funds generated internally, which has been used in the past, and he did not see any reason to depart from this figure. Even he suggested that the company can estimate a new corporate cost of capital to reflect the new risk of the projects. Questions: same 1. Discuss the strengths and weakness of each measure of investment presented in the case. Will all the measures rank the projects identically? Why or why not? 2. Rank the projects based on the measurements discussed above. 3. Was it correct in stating that all the measurements necessarily would result in the san ranking order? Why? Explain? 4. Given the limited funds the Company had generated in 2002 which set of projects should STARBIES accept in year 2003? 5. Given the capital rationing, rank the combination of the projects based on any criteria you feel is important. Which set of projects provides the highest value to the Company? Table 1 Annual Income Statement (Values in Millions) Sales Cost of Sales Gross Operating Profit Selling, General & Admin. Expense Other Taxes EBITDA Depreciation EBIT Other Income, Net Total Income Avail for Interest Exp. Interest Expense Pre-tax Income Income Taxes Net Income from Operations Total Common Shares Outstanding Dividends Paid per Share Preferred Dividends Earnings per Share Dec-02 Dec-01 Dec-00 $328.90 $260.00 $206.80 $229.50 $178.30 $142.10 $99.40 $81.70 $64.70 $56.10 $42.80 $34.60 $0.00 $0.00 $0.00 $43.30 $38.90 $30.10 $11.30 $11.40 $9.40 $32.00 $27.50 $20.70 $1.60 -$0.10 $1.70 $31.00 $27.00 $10.90 $6.70 $3.10 $4.30 $24.30 $23.90 $6.60 $10.30 $9.20 $5.30 $14.00 $14.70 $1.30 19.739 19.80 13.60 $0.12 $0.12 $0.12 $0.00 $0.20 $0.90 $0.71 $0.74 $0.10 Dec-99 $97.90 $68.90 $29.00 $16.30 $0.00 $12.70 $3.40 $9.30 $1.80 $11.10 $2.40 $8.70 $2.60 $6.10 6.80 $0.12 $1.00 $0.90 Dec-98 $96.10 $65.40 $30.70 $18.80 $0.00 $11.90 $4.60 $7.30 $1.80 $11.30 $2.30 $9.00 $0.70 $8.20 6.60 $0.11 $1.10 $1.24 Dec-02 Dec-01 Dec-00 Dec-99 Dec-98 Table 2 Annual Balance Sheet (Values in Millions) Assets Current Assets $132.30 $100.60 $32.40 $33.80 $299.20 $57.80 $83.40 $22.90 $5.50 $169.70 $2.20 $69.00 $24.90 $22.60 $118.70 $13.80 $32.80 $12.20 $20.40 $79.30 $21.80 $39.90 $9.80 $15.00 $86.50 Cash and Equivalents Receivables Inventories Other Current Assets Total Current Assets Non-Current Assets Property, Plant & Equipment, Gross Accumulated Depreciation Property, Plant & Equipment, Net Intangibles Other Non-Current Assets Total Non-Current Assets Total Assets $111.70 $47.20 $102.40 $40.10 $94.40 $36.90 $37.30 $27.10 $53.60 $39.60 $64.50 $73.20 $44.60 $182.30 $481.60 $62.30 $22.90 $30.80 $116.00 $285.60 $57.50 $14.70 $23.30 $95.50 $214.30 $10.20 $9.10 $26.00 $45.30 $124.50 $14.00 $11.70 $14.60 $40.30 $126.80 Liabilities & Shareholder's Equity Current Liabilities Accounts Payable $19.10 Short Term Debt $0.00 Other Current Liabilities $75.70 Total Current Liabilities $94.80 $47.40 $0.50 $16.70 $64.60 $44.10 $5.40 $31.70 $81.20 $23.10 $1.90 $19.20 $44.20 $24.40 $6.80 $14.50 $45.70 $137.80 $0.00 $0.00 $0.00 $38.30 $1.20 $34.60 $0.00 $37.00 $0.00 Non-Current liabilities Long Term Debt Deferred Income Taxes Other Non-Current Liabilities Minority Interest Total Non-Current Liabilities Total Liabilities $80.70 $0.00 $218.50 $313.30 $46.60 $0.00 $46.60 $111.20 $27.80 $0.00 $67.30 $148.50 $5.50 $0.00 $40.10 $84.30 $6.00 $0.00 $43.00 $88.70 Shareholder's Equity Preferred Stock Equity Common Stock Equity Total Equity Total Liabilities & Equity $0.00 $168.30 $168.30 $481.60 $0.00 $174.50 $174.50 $285.70 $0.00 $65.80 $65.80 $214.30 $0.10 $40.10 $40.20 $124.50 $0.10 $38.00 $38.10 $126.80 Common Shares Preferred Shares Treasury Shares 19.7 Mil 0 94,000.00 19.8 Mil 0 182,000.00 13.6 Mil 49,000.00 1.4 Mil 6.8 Mil 57,000.00 1.7 Mil 6.6 Mil 61,000.00 1.8 Mil Table 3 Financial Information and Comparable Companies price Dec. 02 Long. Total term Debt Debt Equity Equity Long- term Debt Asset Current Total Debt 60-month Beta Curent LT Debt (000's) Market Capital Million Shares Outstanding (000's) STARBIES CORPORATION STARBIES 25.01 -0.3 0..64 0.82 0.29 $313.30 $137.80 $493.67 19,739 [Type here) 0 1.09 1.72 29.36 35.4 56.75 55 4.65 11.85 49.99 27.33 37.09 0.93 1.89 -0.21 -0.16 2.46 1.61 0.41 -0.11 0.48 0.05 1.38 1.73 0.41 1.08 0.05 0.61 0.51 0.4 0.16 1.06 0.04 0.54 0.49 0.39 0 0.28 0.33 0.07 0.34 0.03 0.23 0.22 0.22 $42.00 $825.50 $799.60 $81.20 $495.90 $33.00 $256.60 $223.30 $0.00 $319.50 $795.50 $0.10 $487.50 $30.90 $230.90 $215.50 $5.197.13 177,014 $4.164.03 117,628 $2.191.86 38,623 $1.343.77 24,523 $ $1,145.88 246,425 $787.78 66,479 $755.55 15.114 $732.58 26,805 $587.73 15,846 $214.70 $212.40 0.63 0.31 0 26.35 84.95 22.35 23.55 0.68 3.64 0.5 -0.53 0.58 0.4 0.11 0.02 0.71 0.07 0.21 0.24 0.17 NS 0.12 0 0.2 0.08 0.01 NA 0.08 0 $279.60 $0.50 $22.70 $23.40 $0.20 $55.00 $1.60 $0.00 0 0.12 0.04 0 0.63 0.06 0 $246.80 $0.00 $18.60 $9.20 $0.00 $54.90 $0.80 $0.00 $555.33 $272.26 $220.68 $129.67 $57.53 $44.77 $19.88 $8.83 19.6 21,075 3,205 9.874 5.506 2.935 6.498 6,670 1,762 6.89 2.98 5.01 ROCKWELL COLLINS INC COL EMBR EMPRS BRSL DE AERO ERJ ALLIANT TECHSYSTEMS INC ATK ENGINEERED SUPPORT SYS EAST CAE INC CGT AEROFLEX INC ARXX MOOG INC CL A MOG.A DRS TECHNOLOGIES DRS TRIUMPH GROUP INC TGI Defense ESTERLINE TECHNOLOGY CP ESL TASER INTERNATIONAL INC TASR | DUCOMMUN INC DCO ALLIED DEFENSE GROUP ADG REINHOLD INDUSTRIES INC RNHDA TRANSTECHNOLOGY CORP TT HI-SHEAR TECHNOLOGY CORP HSR KREISLER MANUFACTURING KRSL Engineering AVIALL INC AVI CURTISS-WRIGHT CP CL CM CW SIMULA INC SMU TODD SHIPYARDS CORP TOD UNITED INDUSTRIAL CORP UIC SIFCO INDUSTRIES INC SIF VALPEY FISHER CORP VPF Communications and Aerospace AAR CORP AIR BE AEROSPACE INC BEAV HEXCEL CORP HXL HEICO CORP HET PEMCO AVIATION GROUP INC PAGI FAIRCHILD CORP A FA CPI AEROSTRUCTURES INC CVU AEROSONIC CORP AIM HAWK CORP HWK ORBITAL SCIENCES CORP ORB FIRST AVIATION SRVCS INC FAVS ICTS INTERNATIONAL NV ICTS SPACEHAB INC SPAB MERCURY AIR GROUP INC MAX LM AEROSPACE INC LMIA 15.6 44.92 3.19 17.61 17.97 3.95 3.03 1.08 0 1.05 0.16 0.54 0.78 1.53 0.97 0.37 NS 0 0 0.34 0.1 0.34 0.29 NA 0 0 0.3 0.12 0.15 0.59 0 0 0.15 0 $208.60 $223.60 $59.80 $0.00 $0.00 $10.50 $0.00 $204.80 $222.70 $0.20 $0.00 $0.00 $492.37 $536.66 $41.96 $93.40 $244.19 $20.35 $12.68 31,562 11.947 13.154 5,304 13,589 5.152 4,185 $9.00 0 $0.00 15.3 5.71 7.38 0.87 12.31 NS 0.56 12.06 NA* 0.24 3.83 0.24 0.78 0 0.15 0.46 0.01 16.64 33.4 5.13 11.6 8.72 3.75 1.05 0.93 0.71 0.4 -0.04 0.5 -0.25 -0.08 0.18 1.44 0.29 -0.55 1.14 0.11 0.08 0.27 3.94 0.05 3.48 0.46 2.43 0.87 0.4 0.17 0.02 0 0.26 1.55 0.85 $220.80 $787.60 $487.30 $44.00 $21.70 $8.30 $0.00 $3.60 $93.60 $140.00 $14.50 $16.20 $80.90 $54.10 $29.30 $174.70 $784.40 $484.60 $44.00 $20.40 $4.30 $0.00 $0.00 $68.70 $138.10 $14.50 $5.90 $77.50 $50.00 $8.80 $487.26 $208.95 $285.76 $160.59 $135.00 $129.20 $61.31 $34.19 $32.15 $584.08 $30.14 $20.19 $22.31 $16.77 $16.28 0 0.13 0.36 0.28 0.22 0 0 0.66 0.11 0.32 31,847 36,594 38,721 9,651 4,042 25,185 5.285 3.921 8,574 47.954 7.281 6,513 12,397 3.289 8.182 12 18 0.4 4.14 3.1 1.8 5.1 1.99 0 NS 1.5 0.77 N/A 0.41 0.65 Table 4- Market Value-Target leverage ratios and Credit Spread for STARBIES and Its Divisions Debt Percentage Credit Spread In Capital above Government Bond Rate STARBIES 45% 1.5% Defense Segment 70% 2% Communications and Space Engineered Materials 40% 30% 1.25% 1.75% Historical Returns, 1926-2002 Average Standard Annual Return Deviation Large Company Stocks 12.20% 20.5% Small Company Stocks 16.9 33.2 Long-Term Corporate Bonds 6.20 8.7 Long-Term Government Bonds 5.8 9.4 U.S. Treasury Bills 3.8 3.2 Inflation 3.1 4.4 Source: Stocks, Bonds, Bills, and Inflation 2003 YearbookTM, Ibbotson Associates, Inc., Chicago (annually updates work by Roger G. Ibbotson and Rex A. Sinquefield). All rights reserved. U.S. government securities/Treasury for different maturity Maturity 5 7 10 20 2000 6.16% 6.20% 6.03% 7.15% 2001 4.56% 4.88% 5.02% 6.25% 2002 3.82% 4.30% 4.60% 5.25% 2003 2.97% 3.52% 4.00% 4.75% U.S. government securities/Treasury bills (Maturity 6-month) 2000 5.90% 2001 3.34% 2002 1.68% 2003 1.05% Starbies Corporation Financial Information The company had total sales of $329 million with net income of $14 million in 2002. The Company posted a one-year sales growth of 43.9% with net profit margin of 3.1%. The company has maintained a constant dividend policy of $0.12 per share and its stock price traded for $25.01 at end of 2002. Tables 1-3 provide the financial information. The Company retired its preferred stock in year 2000 but issued $137.8 million, 10-years debt in 2002. The debt was rated A with a spread above the current government bond rates. The spread between each division's cost of debt and the government bond rate varied by each division due to their risk differentials. Table 4 provides the market value-target leverage ratios and the spread for STARBIES as a whole and for each division D1 Starbies has the following investment opportunities in each of its segments: Defense Segment Initial Annual Net Expected Project Cost Cash Flows Life $1,000,000 $219,120 7 D2 $1,000,000 $319,775 5 D3 $1,000,000 $222,851 8 D4 $2,000,000 $368,580 10 DS $2,000,000 $542,784 6 $7,000,000 Average life 7.2 Communications and Space products Expected Life Project C1 6 C2 5 Initial Cost $1,000,000 $1,000,000 $1,500,000 $1,000,000 $2,000,000 $6,500,000 C3 Annual Net Cash Flows $229,607 $284,315 $356,535 $233.192 $757,982 Average life 8 C4 7 C5 4 6 Engineered Materials Initial Cost Annual Net Cash Flows Expected Life Project E1 3 $1,500,000 $2,000,000 $592,582 $541,141 E2 5 E3 6 E4 $2,000,000 $528,474 $1,000,000 $329,234 $6,500,000 Average life 4 4.5 Edward stated that, the company currently uses a 12 percent cost of capital based on the past capital structure for funds generated internally, which has been used in the past, and he did not see any reason to depart from this figure. Even he suggested that the company can estimate a new corporate cost of capital to reflect the new risk of the projects. Questions: same 1. Discuss the strengths and weakness of each measure of investment presented in the case. Will all the measures rank the projects identically? Why or why not? 2. Rank the projects based on the measurements discussed above. 3. Was it correct in stating that all the measurements necessarily would result in the san ranking order? Why? Explain? 4. Given the limited funds the Company had generated in 2002 which set of projects should STARBIES accept in year 2003? 5. Given the capital rationing, rank the combination of the projects based on any criteria you feel is important. Which set of projects provides the highest value to the Company? Table 1 Annual Income Statement (Values in Millions) Sales Cost of Sales Gross Operating Profit Selling, General & Admin. Expense Other Taxes EBITDA Depreciation EBIT Other Income, Net Total Income Avail for Interest Exp. Interest Expense Pre-tax Income Income Taxes Net Income from Operations Total Common Shares Outstanding Dividends Paid per Share Preferred Dividends Earnings per Share Dec-02 Dec-01 Dec-00 $328.90 $260.00 $206.80 $229.50 $178.30 $142.10 $99.40 $81.70 $64.70 $56.10 $42.80 $34.60 $0.00 $0.00 $0.00 $43.30 $38.90 $30.10 $11.30 $11.40 $9.40 $32.00 $27.50 $20.70 $1.60 -$0.10 $1.70 $31.00 $27.00 $10.90 $6.70 $3.10 $4.30 $24.30 $23.90 $6.60 $10.30 $9.20 $5.30 $14.00 $14.70 $1.30 19.739 19.80 13.60 $0.12 $0.12 $0.12 $0.00 $0.20 $0.90 $0.71 $0.74 $0.10 Dec-99 $97.90 $68.90 $29.00 $16.30 $0.00 $12.70 $3.40 $9.30 $1.80 $11.10 $2.40 $8.70 $2.60 $6.10 6.80 $0.12 $1.00 $0.90 Dec-98 $96.10 $65.40 $30.70 $18.80 $0.00 $11.90 $4.60 $7.30 $1.80 $11.30 $2.30 $9.00 $0.70 $8.20 6.60 $0.11 $1.10 $1.24 Dec-02 Dec-01 Dec-00 Dec-99 Dec-98 Table 2 Annual Balance Sheet (Values in Millions) Assets Current Assets $132.30 $100.60 $32.40 $33.80 $299.20 $57.80 $83.40 $22.90 $5.50 $169.70 $2.20 $69.00 $24.90 $22.60 $118.70 $13.80 $32.80 $12.20 $20.40 $79.30 $21.80 $39.90 $9.80 $15.00 $86.50 Cash and Equivalents Receivables Inventories Other Current Assets Total Current Assets Non-Current Assets Property, Plant & Equipment, Gross Accumulated Depreciation Property, Plant & Equipment, Net Intangibles Other Non-Current Assets Total Non-Current Assets Total Assets $111.70 $47.20 $102.40 $40.10 $94.40 $36.90 $37.30 $27.10 $53.60 $39.60 $64.50 $73.20 $44.60 $182.30 $481.60 $62.30 $22.90 $30.80 $116.00 $285.60 $57.50 $14.70 $23.30 $95.50 $214.30 $10.20 $9.10 $26.00 $45.30 $124.50 $14.00 $11.70 $14.60 $40.30 $126.80 Liabilities & Shareholder's Equity Current Liabilities Accounts Payable $19.10 Short Term Debt $0.00 Other Current Liabilities $75.70 Total Current Liabilities $94.80 $47.40 $0.50 $16.70 $64.60 $44.10 $5.40 $31.70 $81.20 $23.10 $1.90 $19.20 $44.20 $24.40 $6.80 $14.50 $45.70 $137.80 $0.00 $0.00 $0.00 $38.30 $1.20 $34.60 $0.00 $37.00 $0.00 Non-Current liabilities Long Term Debt Deferred Income Taxes Other Non-Current Liabilities Minority Interest Total Non-Current Liabilities Total Liabilities $80.70 $0.00 $218.50 $313.30 $46.60 $0.00 $46.60 $111.20 $27.80 $0.00 $67.30 $148.50 $5.50 $0.00 $40.10 $84.30 $6.00 $0.00 $43.00 $88.70 Shareholder's Equity Preferred Stock Equity Common Stock Equity Total Equity Total Liabilities & Equity $0.00 $168.30 $168.30 $481.60 $0.00 $174.50 $174.50 $285.70 $0.00 $65.80 $65.80 $214.30 $0.10 $40.10 $40.20 $124.50 $0.10 $38.00 $38.10 $126.80 Common Shares Preferred Shares Treasury Shares 19.7 Mil 0 94,000.00 19.8 Mil 0 182,000.00 13.6 Mil 49,000.00 1.4 Mil 6.8 Mil 57,000.00 1.7 Mil 6.6 Mil 61,000.00 1.8 Mil Table 3 Financial Information and Comparable Companies price Dec. 02 Long. Total term Debt Debt Equity Equity Long- term Debt Asset Current Total Debt 60-month Beta Curent LT Debt (000's) Market Capital Million Shares Outstanding (000's) STARBIES CORPORATION STARBIES 25.01 -0.3 0..64 0.82 0.29 $313.30 $137.80 $493.67 19,739 [Type here) 0 1.09 1.72 29.36 35.4 56.75 55 4.65 11.85 49.99 27.33 37.09 0.93 1.89 -0.21 -0.16 2.46 1.61 0.41 -0.11 0.48 0.05 1.38 1.73 0.41 1.08 0.05 0.61 0.51 0.4 0.16 1.06 0.04 0.54 0.49 0.39 0 0.28 0.33 0.07 0.34 0.03 0.23 0.22 0.22 $42.00 $825.50 $799.60 $81.20 $495.90 $33.00 $256.60 $223.30 $0.00 $319.50 $795.50 $0.10 $487.50 $30.90 $230.90 $215.50 $5.197.13 177,014 $4.164.03 117,628 $2.191.86 38,623 $1.343.77 24,523 $ $1,145.88 246,425 $787.78 66,479 $755.55 15.114 $732.58 26,805 $587.73 15,846 $214.70 $212.40 0.63 0.31 0 26.35 84.95 22.35 23.55 0.68 3.64 0.5 -0.53 0.58 0.4 0.11 0.02 0.71 0.07 0.21 0.24 0.17 NS 0.12 0 0.2 0.08 0.01 NA 0.08 0 $279.60 $0.50 $22.70 $23.40 $0.20 $55.00 $1.60 $0.00 0 0.12 0.04 0 0.63 0.06 0 $246.80 $0.00 $18.60 $9.20 $0.00 $54.90 $0.80 $0.00 $555.33 $272.26 $220.68 $129.67 $57.53 $44.77 $19.88 $8.83 19.6 21,075 3,205 9.874 5.506 2.935 6.498 6,670 1,762 6.89 2.98 5.01 ROCKWELL COLLINS INC COL EMBR EMPRS BRSL DE AERO ERJ ALLIANT TECHSYSTEMS INC ATK ENGINEERED SUPPORT SYS EAST CAE INC CGT AEROFLEX INC ARXX MOOG INC CL A MOG.A DRS TECHNOLOGIES DRS TRIUMPH GROUP INC TGI Defense ESTERLINE TECHNOLOGY CP ESL TASER INTERNATIONAL INC TASR | DUCOMMUN INC DCO ALLIED DEFENSE GROUP ADG REINHOLD INDUSTRIES INC RNHDA TRANSTECHNOLOGY CORP TT HI-SHEAR TECHNOLOGY CORP HSR KREISLER MANUFACTURING KRSL Engineering AVIALL INC AVI CURTISS-WRIGHT CP CL CM CW SIMULA INC SMU TODD SHIPYARDS CORP TOD UNITED INDUSTRIAL CORP UIC SIFCO INDUSTRIES INC SIF VALPEY FISHER CORP VPF Communications and Aerospace AAR CORP AIR BE AEROSPACE INC BEAV HEXCEL CORP HXL HEICO CORP HET PEMCO AVIATION GROUP INC PAGI FAIRCHILD CORP A FA CPI AEROSTRUCTURES INC CVU AEROSONIC CORP AIM HAWK CORP HWK ORBITAL SCIENCES CORP ORB FIRST AVIATION SRVCS INC FAVS ICTS INTERNATIONAL NV ICTS SPACEHAB INC SPAB MERCURY AIR GROUP INC MAX LM AEROSPACE INC LMIA 15.6 44.92 3.19 17.61 17.97 3.95 3.03 1.08 0 1.05 0.16 0.54 0.78 1.53 0.97 0.37 NS 0 0 0.34 0.1 0.34 0.29 NA 0 0 0.3 0.12 0.15 0.59 0 0 0.15 0 $208.60 $223.60 $59.80 $0.00 $0.00 $10.50 $0.00 $204.80 $222.70 $0.20 $0.00 $0.00 $492.37 $536.66 $41.96 $93.40 $244.19 $20.35 $12.68 31,562 11.947 13.154 5,304 13,589 5.152 4,185 $9.00 0 $0.00 15.3 5.71 7.38 0.87 12.31 NS 0.56 12.06 NA* 0.24 3.83 0.24 0.78 0 0.15 0.46 0.01 16.64 33.4 5.13 11.6 8.72 3.75 1.05 0.93 0.71 0.4 -0.04 0.5 -0.25 -0.08 0.18 1.44 0.29 -0.55 1.14 0.11 0.08 0.27 3.94 0.05 3.48 0.46 2.43 0.87 0.4 0.17 0.02 0 0.26 1.55 0.85 $220.80 $787.60 $487.30 $44.00 $21.70 $8.30 $0.00 $3.60 $93.60 $140.00 $14.50 $16.20 $80.90 $54.10 $29.30 $174.70 $784.40 $484.60 $44.00 $20.40 $4.30 $0.00 $0.00 $68.70 $138.10 $14.50 $5.90 $77.50 $50.00 $8.80 $487.26 $208.95 $285.76 $160.59 $135.00 $129.20 $61.31 $34.19 $32.15 $584.08 $30.14 $20.19 $22.31 $16.77 $16.28 0 0.13 0.36 0.28 0.22 0 0 0.66 0.11 0.32 31,847 36,594 38,721 9,651 4,042 25,185 5.285 3.921 8,574 47.954 7.281 6,513 12,397 3.289 8.182 12 18 0.4 4.14 3.1 1.8 5.1 1.99 0 NS 1.5 0.77 N/A 0.41 0.65 Table 4- Market Value-Target leverage ratios and Credit Spread for STARBIES and Its Divisions Debt Percentage Credit Spread In Capital above Government Bond Rate STARBIES 45% 1.5% Defense Segment 70% 2% Communications and Space Engineered Materials 40% 30% 1.25% 1.75% Historical Returns, 1926-2002 Average Standard Annual Return Deviation Large Company Stocks 12.20% 20.5% Small Company Stocks 16.9 33.2 Long-Term Corporate Bonds 6.20 8.7 Long-Term Government Bonds 5.8 9.4 U.S. Treasury Bills 3.8 3.2 Inflation 3.1 4.4 Source: Stocks, Bonds, Bills, and Inflation 2003 YearbookTM, Ibbotson Associates, Inc., Chicago (annually updates work by Roger G. Ibbotson and Rex A. Sinquefield). All rights reserved. U.S. government securities/Treasury for different maturity Maturity 5 7 10 20 2000 6.16% 6.20% 6.03% 7.15% 2001 4.56% 4.88% 5.02% 6.25% 2002 3.82% 4.30% 4.60% 5.25% 2003 2.97% 3.52% 4.00% 4.75% U.S. government securities/Treasury bills (Maturity 6-month) 2000 5.90% 2001 3.34% 2002 1.68% 2003 1.05%Step by Step Solution
There are 3 Steps involved in it
Step: 1

Get Instant Access to Expert-Tailored Solutions
See step-by-step solutions with expert insights and AI powered tools for academic success
Step: 2

Step: 3
Ace Your Homework with AI
Get the answers you need in no time with our AI-driven, step-by-step assistance
Get Started
Finance For Food Towards New Agricultural And Rural Finance
Authors: Doris Köhn
1st Edition
3662568659, 978-3662568651