Answered step by step
Verified Expert Solution
Link Copied!

Question

1 Approved Answer

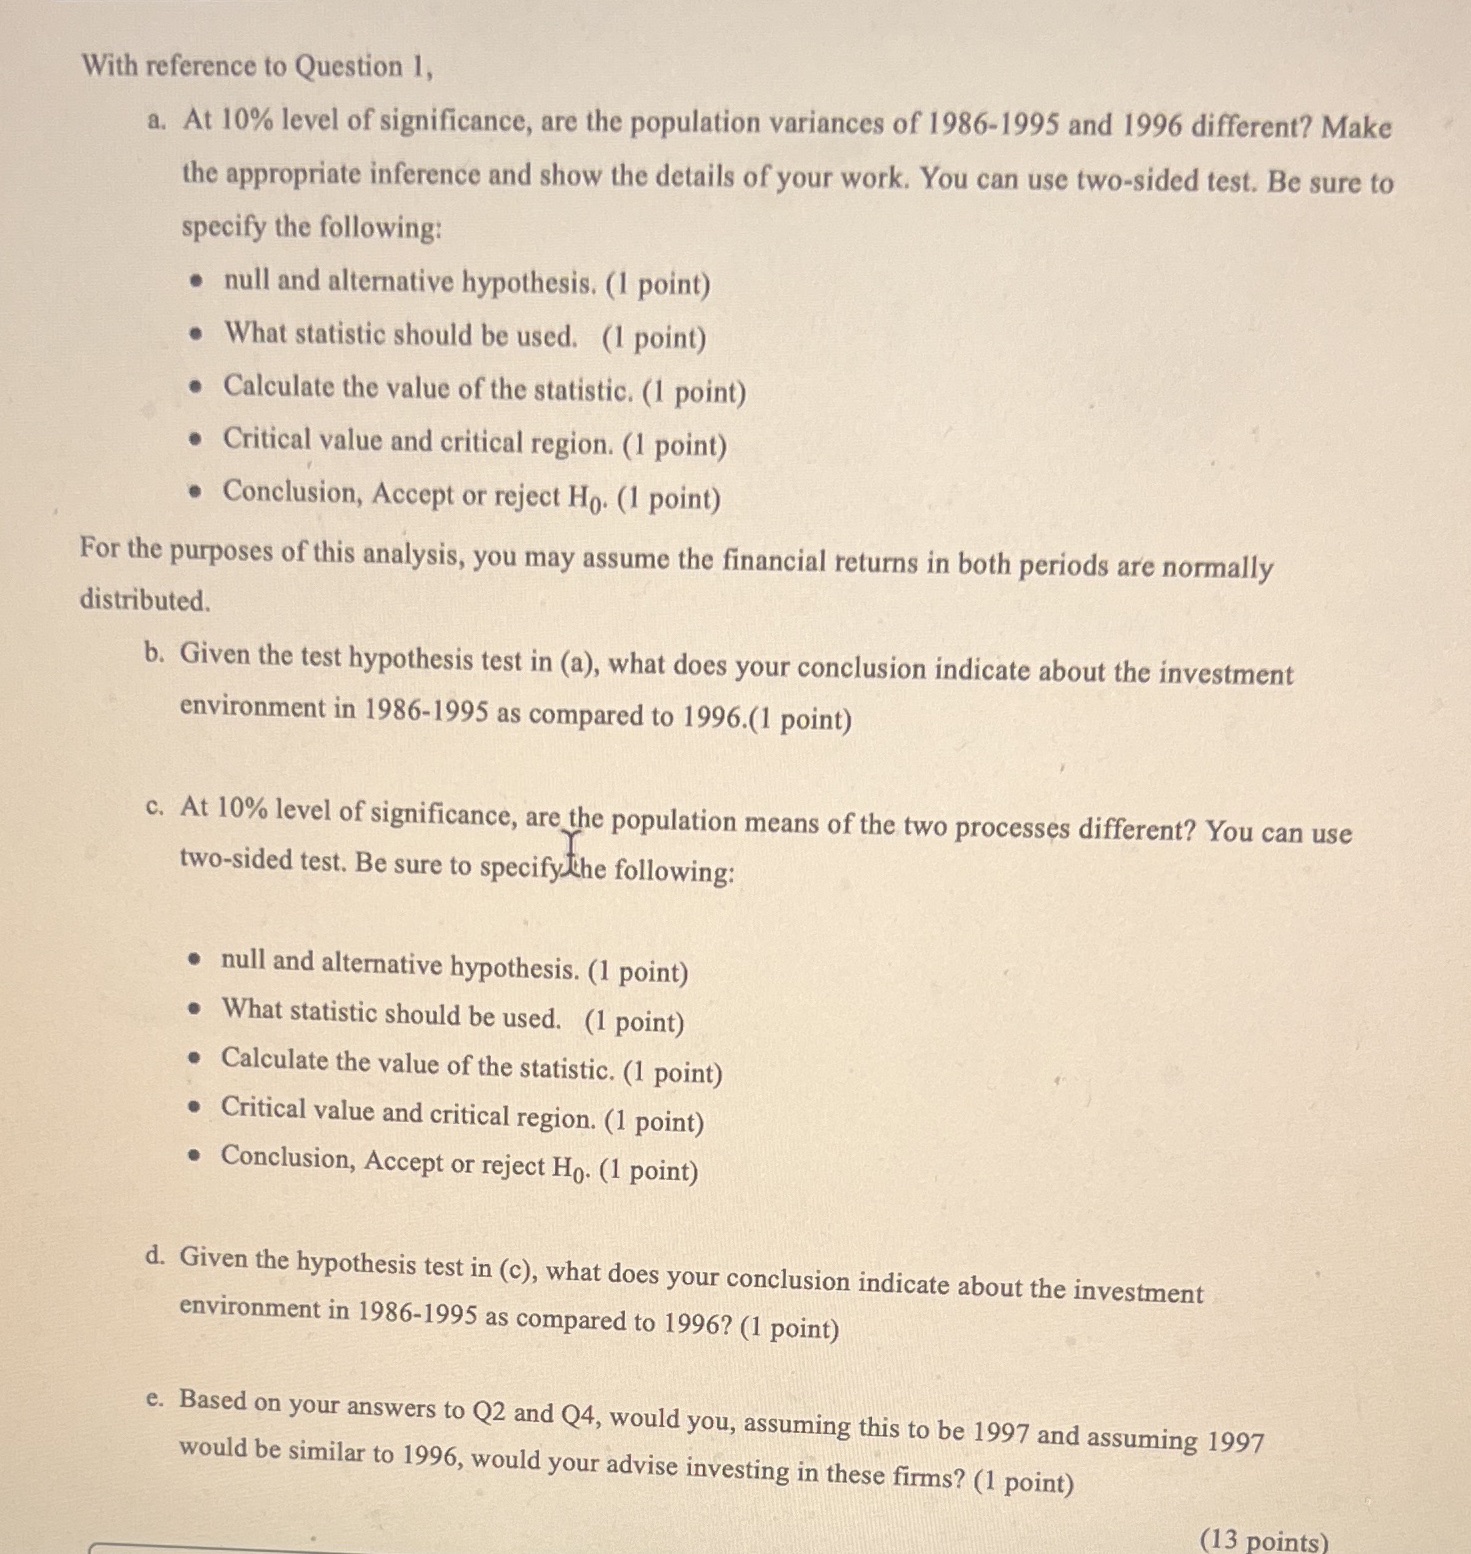
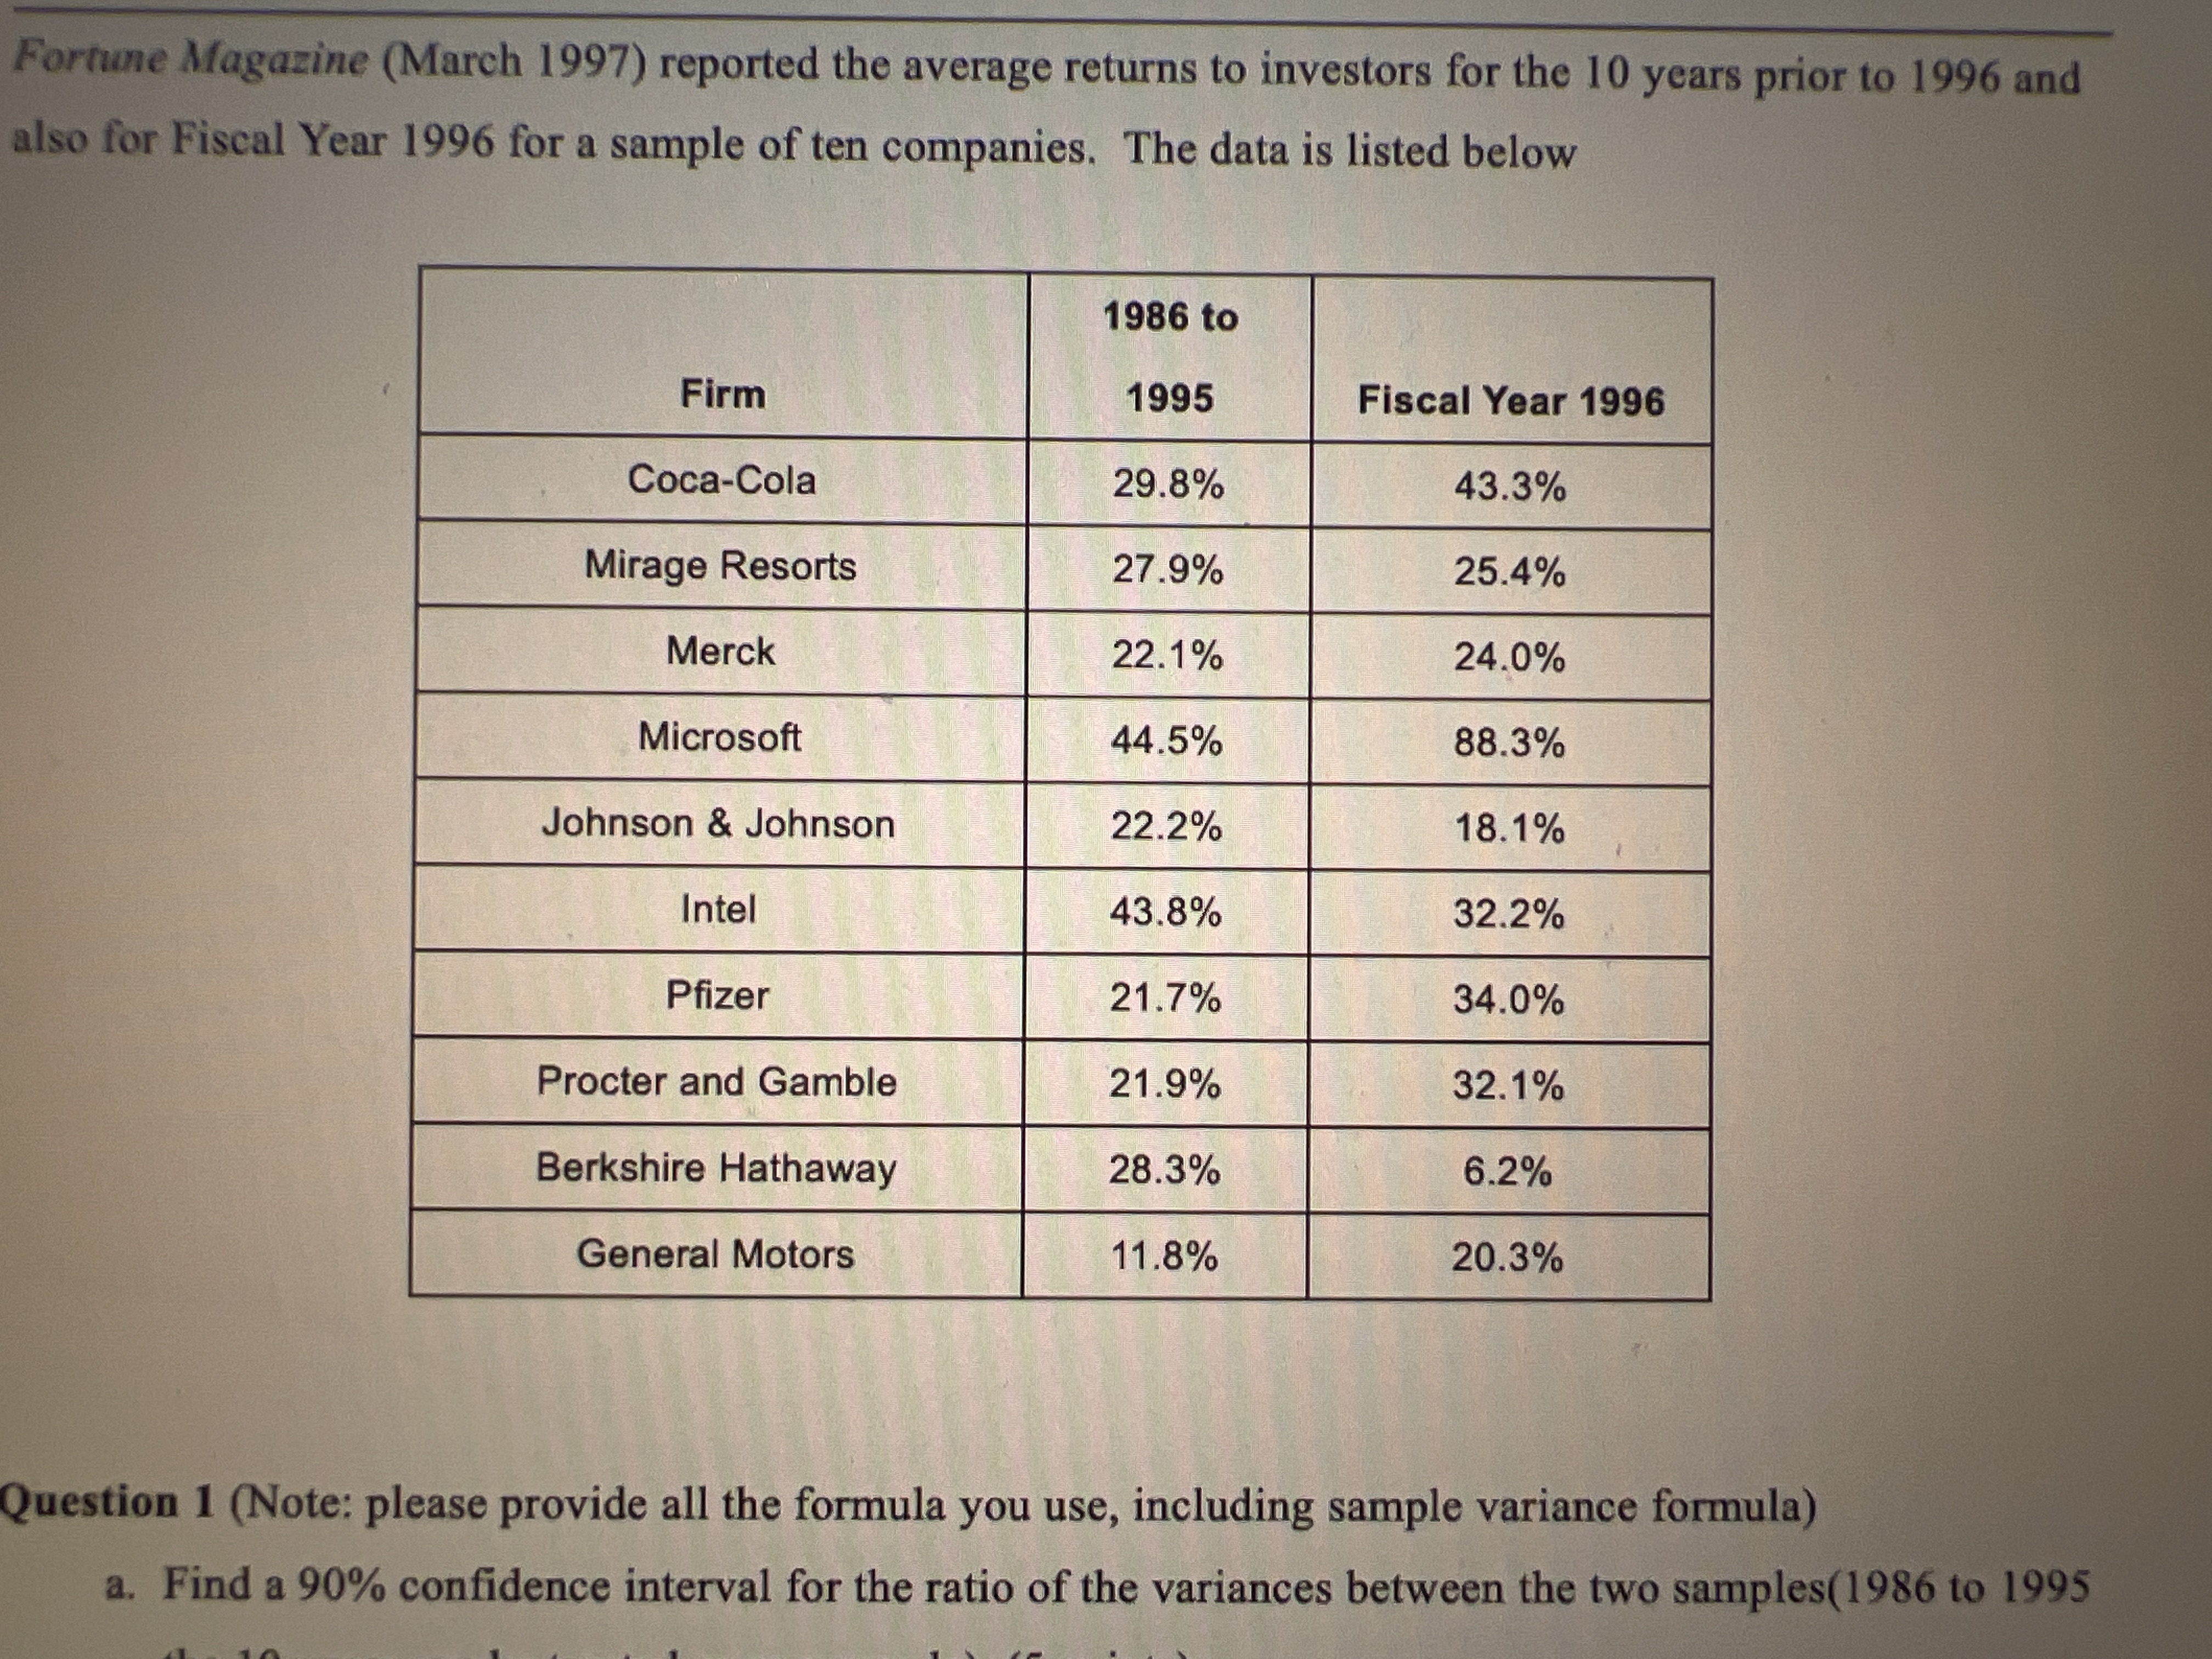
Please show work With reference to Question 1, a. At 10% level of significance, are the population variances of 1986-1995 and 1996 different? Make the

image text in transcribedimage text in transcribed

Please show work

image text in transcribedimage text in transcribed
With reference to Question 1, a. At 10% level of significance, are the population variances of 1986-1995 and 1996 different? Make the appropriate inference and show the details of your work. You can use two-sided test. Be sure to specify the following: . null and alternative hypothesis. (1 point) . What statistic should be used. (1 point) . Calculate the value of the statistic. (1 point) . Critical value and critical region. (1 point) . Conclusion, Accept or reject Ho. (1 point) For the purposes of this analysis, you may assume the financial returns in both periods are normally distributed. b. Given the test hypothesis test in (a), what does your conclusion indicate about the investment environment in 1986-1995 as compared to 1996.(1 point) c. At 10% level of significance, are the population means of the two processes different? You can use two-sided test. Be sure to specify the following: . null and alternative hypothesis. (1 point) . What statistic should be used. (1 point) . Calculate the value of the statistic. (1 point) . Critical value and critical region. (1 point) . Conclusion, Accept or reject Ho. (1 point) d. Given the hypothesis test in (c), what does your conclusion indicate about the investment environment in 1986-1995 as compared to 1996? (1 point) e. Based on your answers to Q2 and Q4, would you, assuming this to be 1997 and assuming 1997 would be similar to 1996, would your advise investing in these firms? (1 point) (13 points)Fortune Magazine (March 1997) reported the average returns to investors for the 10 years prior to 1996 and also for Fiscal Year 1996 for a sample of ten companies. The data is listed below 1986 to Firm 1995 Fiscal Year 1996 Coca-Cola 29.8% 43.3% Mirage Resorts 27.9% 25.4% Merck 22.1% 24.0% Microsoft 44.5% 88.3% Johnson & Johnson 22.2% 18.1% Intel 43.8% 32.2% Pfizer 21.7% 34.0% Procter and Gamble 21.9% 32.1% Berkshire Hathaway 28.3% 6.2% General Motors 11.8% 20.3% Question 1 (Note: please provide all the formula you use, including sample variance formula) a. Find a 90% confidence interval for the ratio of the variances between the two samples(1986 to 1995

Step by Step Solution

There are 3 Steps involved in it

Step: 1

blur-text-image

Get Instant Access to Expert-Tailored Solutions

See step-by-step solutions with expert insights and AI powered tools for academic success

Step: 2

blur-text-image

Step: 3

blur-text-image

Ace Your Homework with AI

Get the answers you need in no time with our AI-driven, step-by-step assistance

Get Started

Recommended Textbook for

Elementary Number Theory

Authors: James K Strayer

1st Edition

1478618507, 9781478618508

More Books

Students also viewed these Mathematics questions

Question

What is the relationship between due professional and negligence?

Answered: 1 week ago