 Please show your formula step by step! I will rate very high!
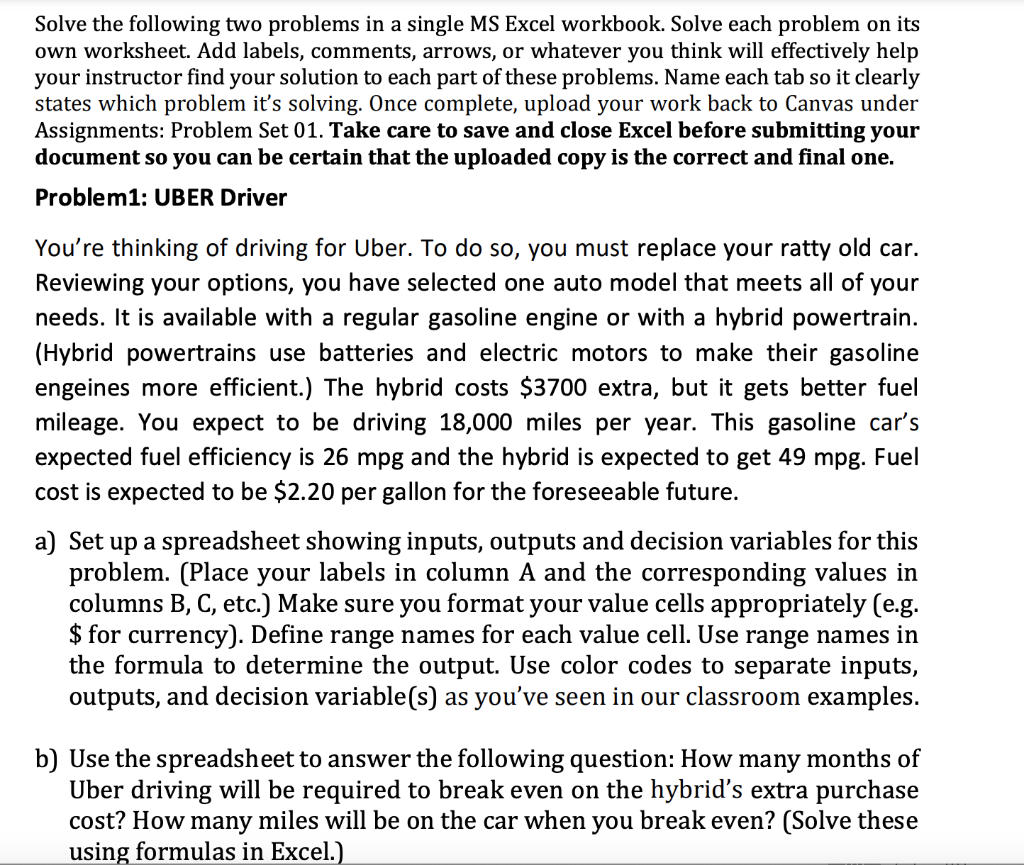
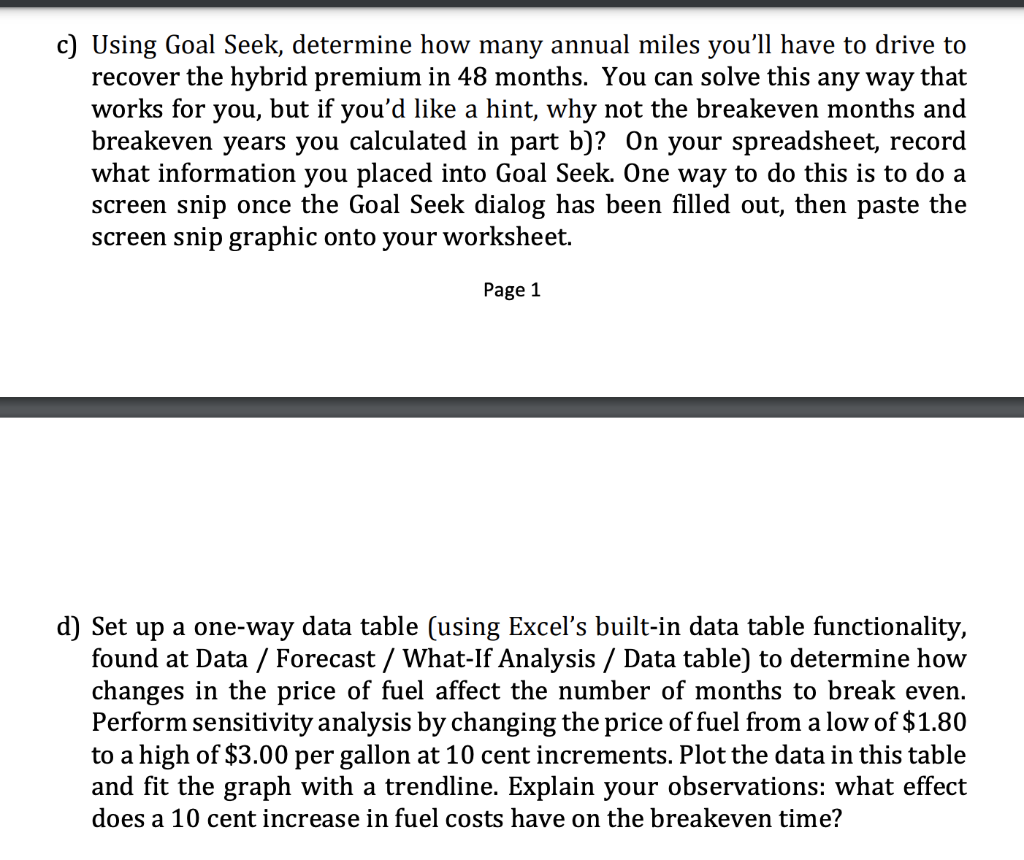
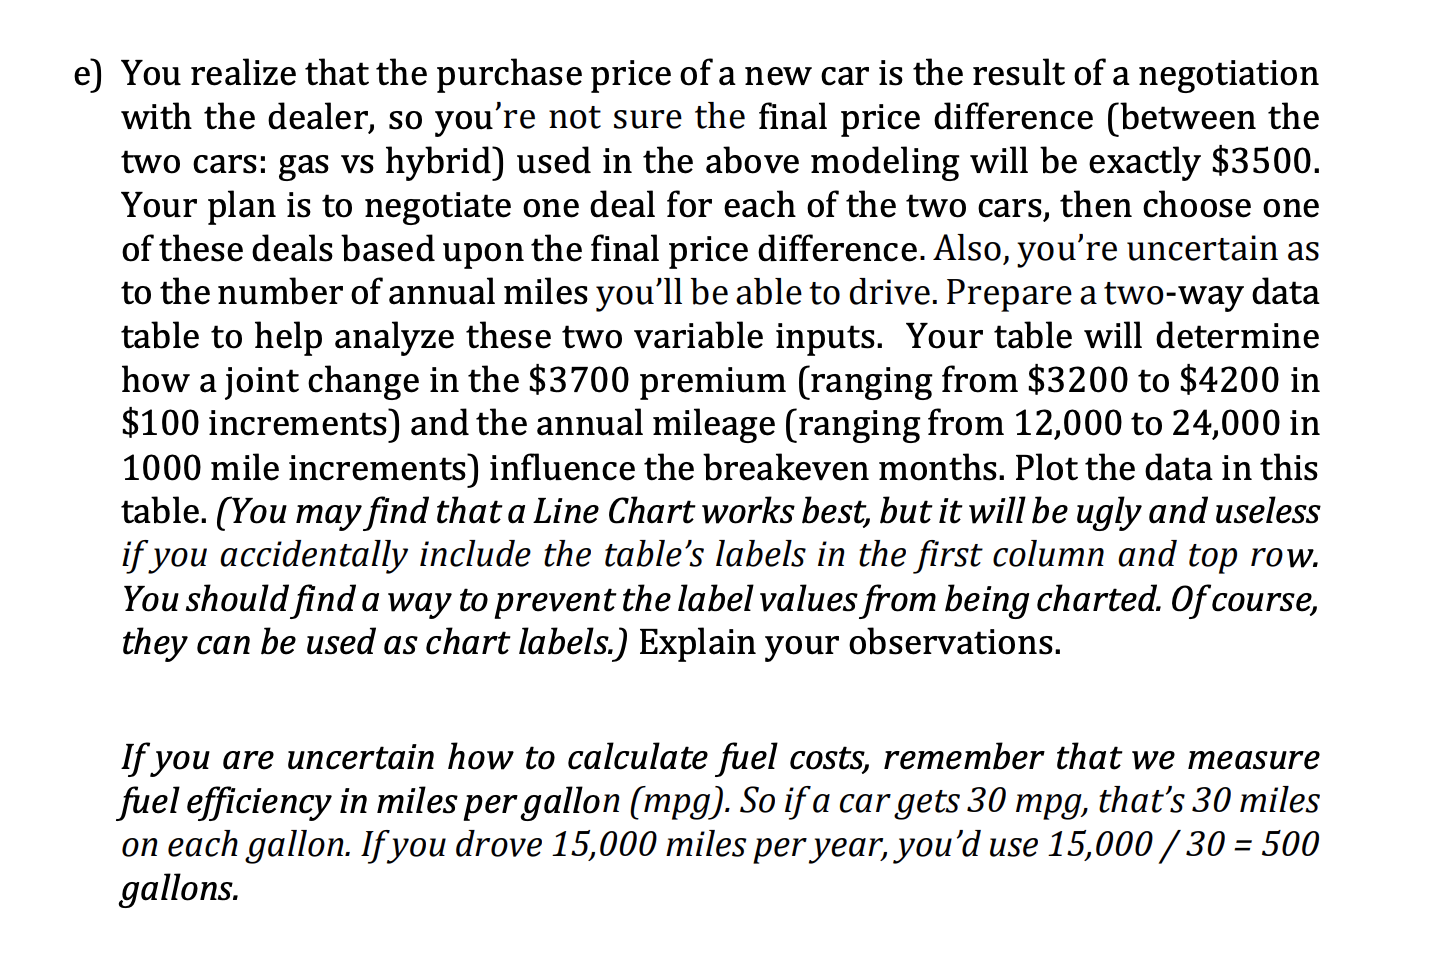
Solve the following two problems in a single MS Excel workbook. Solve each problem on its own worksheet. Add labels, comments, arrows, or whatever you think will effectively help your instructor find your solution to each part of these problems. Name each tab so it clearly states which problem it's solving. Once complete, upload your work back to Canvas under Assignments: Problem Set 01. Take care to save and close Excel before submitting your document so you can be certain that the uploaded copy is the correct and final one. Problem1: UBER Driver You're thinking of driving for Uber. To do so, you must replace your ratty old car. Reviewing your options, you have selected one auto model that meets all of your needs. It is available with a regular gasoline engine or with a hybrid powertrain. (Hybrid powertrains use batteries and electric motors to make their gasoline engeines more efficient.) The hybrid costs $3700 extra, but it gets better fuel mileage. You expect to be driving 18,000 miles per year. This gasoline car's expected fuel efficiency is 26 mpg and the hybrid is expected to get 49 mpg. Fuel cost is expected to be $2.20 per gallon for the foreseeable future. a) Set up a spreadsheet showing inputs, outputs and decision variables for this problem. (Place your labels in column A and the corresponding values in columns B, C, etc.) Make sure you format your value cells appropriately (e.g. $for currency). Define range names for each value cell. Use range names in the formula to determine the output. Use color codes to separate inputs, outputs, and decision variable(s) as you've seen in our classroom examples. b) Use the spreadsheet to answer the following question: How many months of Uber driving will be required to break even on the hybrid's extra purchase cost? How many miles will be on the car when you break even? (Solve these using formulas in Excel.). c) Using Goal Seek, determine how many annual miles you'll have to drive to recover the hybrid premium in 48 months. You can solve this any way that works for you, but if you'd like a hint, why not the breakeven months and breakeven years you calculated in part b)? On your spreadsheet, record what information you placed into Goal Seek. One way to do this is to do a screen snip once the Goal Seek dialog has been filled out, then paste the screen snip graphic onto your worksheet. Page 1 d) Set up a one-way data table (using Excel's built-in data table functionality, found at Data / Forecast / What-If Analysis / Data table) to determine how changes in the price of fuel affect the number of months to break even. Perform sensitivity analysis by changing the price of fuel from a low of $1.80 to a high of $3.00 per gallon at 10 cent increments. Plot the data in this table and fit the graph with a trendline. Explain your observations: what effect does a 10 cent increase in fuel costs have on the breakeven time? e) You realize that the purchase price of a new car is the result of a negotiation with the dealer, so you're not sure the final price difference (between the two cars: gas vs hybrid) used in the above modeling will be exactly $3500. Your plan is to negotiate one deal for each of the two cars, then choose one of these deals based upon the final price difference. Also, you're uncertain as to the number of annual miles you'll be able to drive. Prepare a two-way data table to help analyze these two variable inputs. Your table will determine how a joint change in the $3700 premium (ranging from $3200 to $4200 in $100 increments) and the annual mileage (ranging from 12,000 to 24,000 in 1000 mile increments) influence the breakeven months. Plot the data in this table. (You may find that a Line Chart works best, but it will be ugly and useless if you accidentally include the table's labels in the first column and top row. You should find a way to prevent the label values from being charted. Of course, they can be used as chart labels.) Explain your observations. If you are uncertain how to calculate fuel costs, remember that we measure fuel efficiency in miles per gallon (mpg). So if a car gets 30 mpg, that's 30 miles on each gallon. If you drove 15,000 miles per year, you'd use 15,000 / 30 = 500 gallons. Solve the following two problems in a single MS Excel workbook. Solve each problem on its own worksheet. Add labels, comments, arrows, or whatever you think will effectively help your instructor find your solution to each part of these problems. Name each tab so it clearly states which problem it's solving. Once complete, upload your work back to Canvas under Assignments: Problem Set 01. Take care to save and close Excel before submitting your document so you can be certain that the uploaded copy is the correct and final one. Problem1: UBER Driver You're thinking of driving for Uber. To do so, you must replace your ratty old car. Reviewing your options, you have selected one auto model that meets all of your needs. It is available with a regular gasoline engine or with a hybrid powertrain. (Hybrid powertrains use batteries and electric motors to make their gasoline engeines more efficient.) The hybrid costs $3700 extra, but it gets better fuel mileage. You expect to be driving 18,000 miles per year. This gasoline car's expected fuel efficiency is 26 mpg and the hybrid is expected to get 49 mpg. Fuel cost is expected to be $2.20 per gallon for the foreseeable future. a) Set up a spreadsheet showing inputs, outputs and decision variables for this problem. (Place your labels in column A and the corresponding values in columns B, C, etc.) Make sure you format your value cells appropriately (e.g. $for currency). Define range names for each value cell. Use range names in the formula to determine the output. Use color codes to separate inputs, outputs, and decision variable(s) as you've seen in our classroom examples. b) Use the spreadsheet to answer the following question: How many months of Uber driving will be required to break even on the hybrid's extra purchase cost? How many miles will be on the car when you break even? (Solve these using formulas in Excel.). c) Using Goal Seek, determine how many annual miles you'll have to drive to recover the hybrid premium in 48 months. You can solve this any way that works for you, but if you'd like a hint, why not the breakeven months and breakeven years you calculated in part b)? On your spreadsheet, record what information you placed into Goal Seek. One way to do this is to do a screen snip once the Goal Seek dialog has been filled out, then paste the screen snip graphic onto your worksheet. Page 1 d) Set up a one-way data table (using Excel's built-in data table functionality, found at Data / Forecast / What-If Analysis / Data table) to determine how changes in the price of fuel affect the number of months to break even. Perform sensitivity analysis by changing the price of fuel from a low of $1.80 to a high of $3.00 per gallon at 10 cent increments. Plot the data in this table and fit the graph with a trendline. Explain your observations: what effect does a 10 cent increase in fuel costs have on the breakeven time? e) You realize that the purchase price of a new car is the result of a negotiation with the dealer, so you're not sure the final price difference (between the two cars: gas vs hybrid) used in the above modeling will be exactly $3500. Your plan is to negotiate one deal for each of the two cars, then choose one of these deals based upon the final price difference. Also, you're uncertain as to the number of annual miles you'll be able to drive. Prepare a two-way data table to help analyze these two variable inputs. Your table will determine how a joint change in the $3700 premium (ranging from $3200 to $4200 in $100 increments) and the annual mileage (ranging from 12,000 to 24,000 in 1000 mile increments) influence the breakeven months. Plot the data in this table. (You may find that a Line Chart works best, but it will be ugly and useless if you accidentally include the table's labels in the first column and top row. You should find a way to prevent the label values from being charted. Of course, they can be used as chart labels.) Explain your observations. If you are uncertain how to calculate fuel costs, remember that we measure fuel efficiency in miles per gallon (mpg). So if a car gets 30 mpg, that's 30 miles on each gallon. If you drove 15,000 miles per year, you'd use 15,000 / 30 = 500 gallons